Question
Overview: There is one problem which has two major parts. You need to submit your solution as per guidelines. Your solution should be generic and
Overview:
There is one problem which has two major parts. You need to submit your solution as per guidelines. Your solution should be generic and will be tested with different data in the same format. Use the Python programming language to complete the problem.
Problem:
Real-time Optimization, Scheduling and Logistics (ROSL) research group in Department of Computer Science and Software Engineering (CSSE) bought Remote-controlled Zen Wheel microcars for its research. Researchers developed a testbed for testing different algorithms for autonomous vehicle.While working on the project, researchers developed an interface which can execute pre-determined programs. However, it is found that movement of microcars is not perfect and will sometimes perform an incorrect action.
Researchers when testing their latest development maintain a copy of the intended program but also track what movements have actually been made externally. Each car can perform the following actions:
Move North
Move West
Move East
Move South
Researchers have performed a series of trials where multiple microcars have been tested in sequence and have bundled all the data into two csv files per microcar. One contains the instructions given to each microcar and other contains the actions performed by each microcar.
Your task, given both files is to find:
The final displacement of each microcar from the origin (in both horizontal and vertical axes).
The total distance traveled by each microcar.
Part 1:
Write a function microcar which accepts two inputs. The two inputs are two lists of strings containing names of CSV files (including locations if files are not in the same folder where file containing the function is stored): the first list contains the names of the files (including locations if required) containing the instructions for each microcar and, the second list contains the names of the files (including locations if required) containing the actual actions of each care corresponding to the instructions provided to them.
The two csv files will contain lines in the following format: Action, time, speed - where each action will be specified as:
N, t, s = Move North for t seconds with speed s meters per second
E, t, s = Move East for t seconds with speed s meters per second
W, t, s = Move West for t seconds with speed s meters per second
S, t, s = Move South for t seconds with speed s meters per second
The function will return six numpy arrays:
The expected horizontal displacements for each microcar
The expected vertical displacements for each microcar
The actual horizontal displacements for each microcar
The actual vertical displacements for each microcar
The expected distances traveled by each microcar
The actual distances traveled by each microcar
All displacements and distances are to be presented in meters and rounded to 2 decimal places for the final returned lists. Keep the data rounded to at least 10 decimal places for all intermediate computations.
Additionally the data will adhere to the following constraints:
There will never be a missing instruction. The number of expected and actual instructions will always match.
Both files will contain valid instructions only.
Part 2:
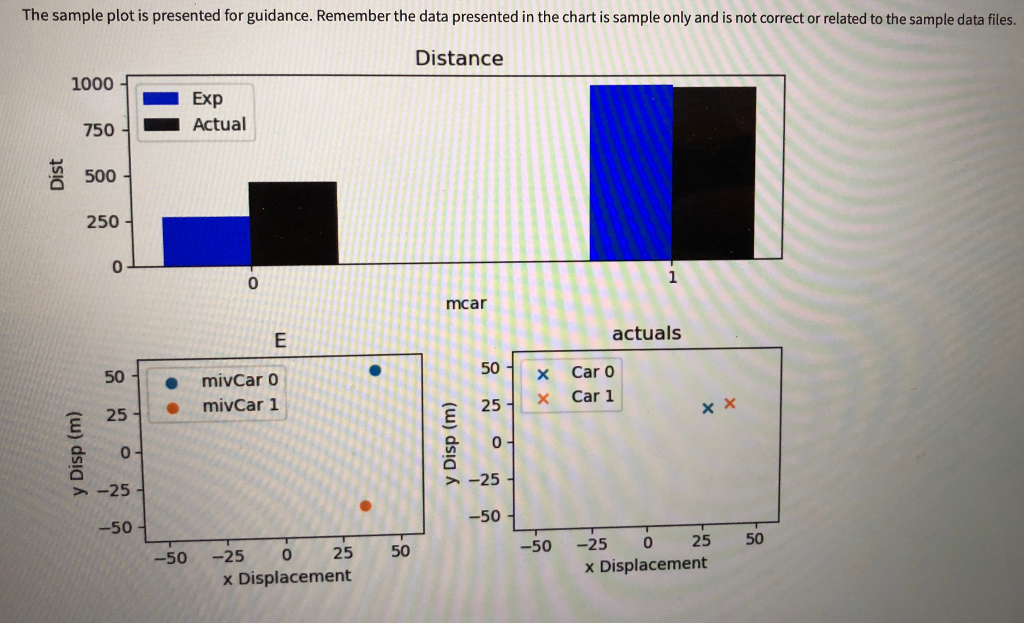
In addition to the function described above, write a second function plotmicrocar which will accept the same arguments and perform the same calculations as before but will additionally create the following plots:
A bar-plot comparing the expected and actual distance covered by each microcar.
A scatter-plot of the expected final horizontal and vertical displacements for each microcar.
A scatter-plot of the actual final horizontal and vertical displacements for each microcar.
We expect these plots to be generated as sub-plots and match the example templates. You need to ensure that scatter plots are square in size and have same dimensions for easy of understanding of the results. In addition, the dimensions should be larger enough such that microcar displacements should not be at the corner of the plots.
Note: when writing plotmicrocar function, dont re-write your code. Make a function call to your original microcar function to generate your data.

Step by Step Solution
There are 3 Steps involved in it
Step: 1

Get Instant Access to Expert-Tailored Solutions
See step-by-step solutions with expert insights and AI powered tools for academic success
Step: 2

Step: 3

Ace Your Homework with AI
Get the answers you need in no time with our AI-driven, step-by-step assistance
Get Started


