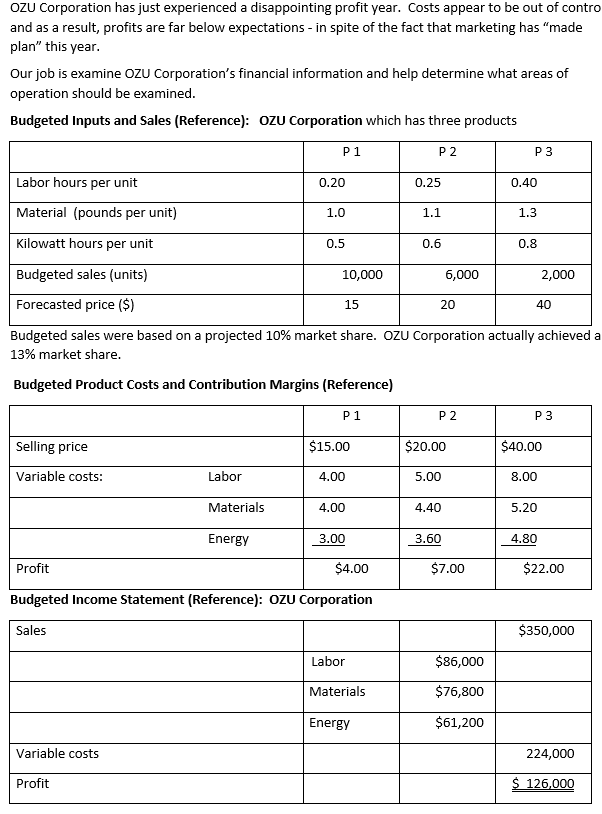
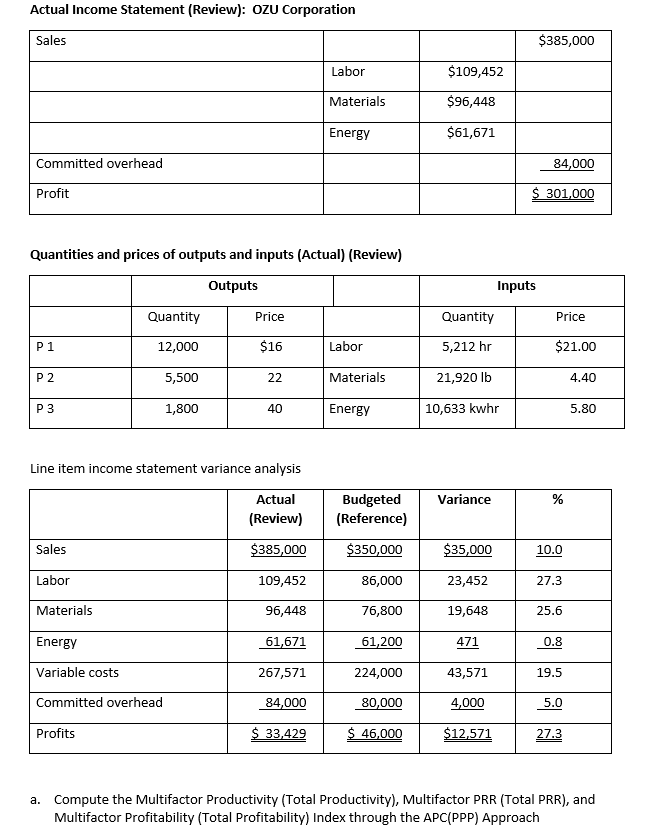
OZU Corporation has just experienced a disappointing profit year. Costs appear to be out of contro and as a result, profits are far below expectations - in spite of the fact that marketing has "made plan" this year. Our job is examine OZU Corporation's financial information and help determine what areas of operation should be examined. Budgeted Inputs and Sales (Reference): OZU Corporation which has three products P1 P2 P 3 Labor hours per unit 0.20 0.25 Material (pounds per unit) 1.0 1.1 Kilowatt hours per unit 0.5 0.6 Budgeted sales (units) 10,000 6,000 2,000 Forecasted price ($) 15 20 40 Budgeted sales were based on a projected 10% market share. OZU Corporation actually achieved a 13% market share. Budgeted Product Costs and Contribution Margins (Reference) P1 P2 P 3 Selling price $15.00 Variable costs: Labor 4.00 Materials 4.00 Energy 3.00 Profit $4.00 Budgeted Income Statement (Reference): OZU Corporation Sales Labor Materials Energy Variable costs Profit $20.00 5.00 4.40 3.60 $7.00 $86,000 $76,800 $61,200 0.40 1.3 0.8 $40.00 8.00 5.20 4.80 $22.00 $350,000 224,000 $ 126,000 Actual Income Statement (Review): OZU Corporation Sales Labor Materials Energy Committed overhead Profit Quantities and prices of outputs and inputs (Actual) (Review) Outputs Quantity Price Quantity P1 12,000 $16 Labor 5,212 hr P2 5,500 22 Materials 21,920 lb P 3 1,800 40 Energy 10,633 kwhr Line item income statement variance analysis Actual Budgeted Variance % (Review) (Reference) Sales $385,000 $350,000 $35,000 10.0 Labor 109,452 86,000 23,452 27.3 Materials 96,448 76,800 19,648 25.6 Energy 61,671 61,200 471 0.8 Variable costs 267,571 224,000 43,571 19.5 Committed overhead 84,000 80,000 4,000 5.0 Profits $ 33,429 $ 46,000 $12,571 27.3 a. Compute the Multifactor Productivity (Total Productivity), Multifactor PRR (Total PRR), and Multifactor Profitability (Total Profitability) Index through the APC(PPP) Approach $109,452 $96,448 $61,671 $385,000 84,000 $ 301,000 Inputs Price $21.00 4.40 5.80 OZU Corporation has just experienced a disappointing profit year. Costs appear to be out of contro and as a result, profits are far below expectations - in spite of the fact that marketing has "made plan" this year. Our job is examine OZU Corporation's financial information and help determine what areas of operation should be examined. Budgeted Inputs and Sales (Reference): OZU Corporation which has three products P1 P2 P 3 Labor hours per unit 0.20 0.25 Material (pounds per unit) 1.0 1.1 Kilowatt hours per unit 0.5 0.6 Budgeted sales (units) 10,000 6,000 2,000 Forecasted price ($) 15 20 40 Budgeted sales were based on a projected 10% market share. OZU Corporation actually achieved a 13% market share. Budgeted Product Costs and Contribution Margins (Reference) P1 P2 P 3 Selling price $15.00 Variable costs: Labor 4.00 Materials 4.00 Energy 3.00 Profit $4.00 Budgeted Income Statement (Reference): OZU Corporation Sales Labor Materials Energy Variable costs Profit $20.00 5.00 4.40 3.60 $7.00 $86,000 $76,800 $61,200 0.40 1.3 0.8 $40.00 8.00 5.20 4.80 $22.00 $350,000 224,000 $ 126,000 Actual Income Statement (Review): OZU Corporation Sales Labor Materials Energy Committed overhead Profit Quantities and prices of outputs and inputs (Actual) (Review) Outputs Quantity Price Quantity P1 12,000 $16 Labor 5,212 hr P2 5,500 22 Materials 21,920 lb P 3 1,800 40 Energy 10,633 kwhr Line item income statement variance analysis Actual Budgeted Variance % (Review) (Reference) Sales $385,000 $350,000 $35,000 10.0 Labor 109,452 86,000 23,452 27.3 Materials 96,448 76,800 19,648 25.6 Energy 61,671 61,200 471 0.8 Variable costs 267,571 224,000 43,571 19.5 Committed overhead 84,000 80,000 4,000 5.0 Profits $ 33,429 $ 46,000 $12,571 27.3 a. Compute the Multifactor Productivity (Total Productivity), Multifactor PRR (Total PRR), and Multifactor Profitability (Total Profitability) Index through the APC(PPP) Approach $109,452 $96,448 $61,671 $385,000 84,000 $ 301,000 Inputs Price $21.00 4.40 5.80