Answered step by step
Verified Expert Solution
Question
1 Approved Answer
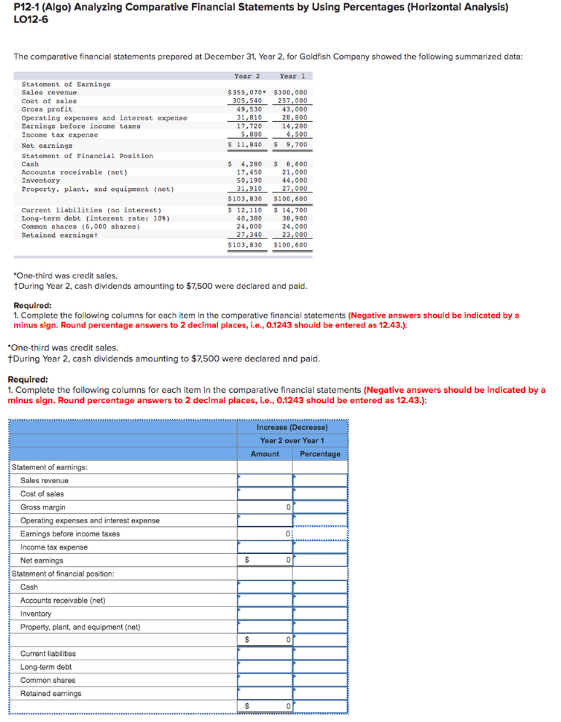
P 1 2 - 1 ( Algo ) Analyzing Comparative Financial Statements by Using Percentages ( Horizontal Analysis ) LO 1 2 - 6 The
PAlgo Analyzing Comparative Financial Statements by Using Percentages Horizontal Analysis LO
The comparative financial statements prepared at December Year for Goldfish Compony showed the following summarized data:
tableYoar Yoar
Please solve statement if earnings percentage chart in the picture and answer the following questions:
Also answer:
gross profit margin ratio: average
Income tax rate: average income tax
Net profit margin ratio. Was it a poor or good indiactor of performance?
Net profit margin ratio and good or poor?
Percentage of total respuced in ppt: percentage
Debt to equity ratio was it good or poor?

Step by Step Solution
There are 3 Steps involved in it
Step: 1

Get Instant Access to Expert-Tailored Solutions
See step-by-step solutions with expert insights and AI powered tools for academic success
Step: 2

Step: 3

Ace Your Homework with AI
Get the answers you need in no time with our AI-driven, step-by-step assistance
Get Started


