

Answered step by step
Verified Expert Solution
Question
1 Approved Answer
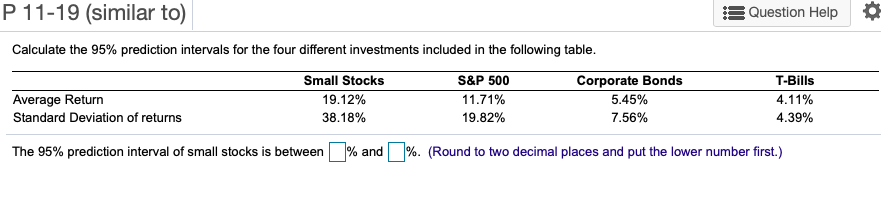
P 11-19 (similar to) Question Help Calculate the 95% prediction intervals for the four different investments included in the following table. Average Return Standard Deviation
Step by Step Solution
There are 3 Steps involved in it
Step: 1

Get Instant Access to Expert-Tailored Solutions
See step-by-step solutions with expert insights and AI powered tools for academic success
Step: 2

Step: 3
Ace Your Homework with AI
Get the answers you need in no time with our AI-driven, step-by-step assistance
Get Started
The Secret Of Real Estate Best Strategies On How To Earn With Real Estate Investments
Authors: Chris Brandon
1st Edition
979-8838170026