

Answered step by step
Verified Expert Solution
Question
1 Approved Answer
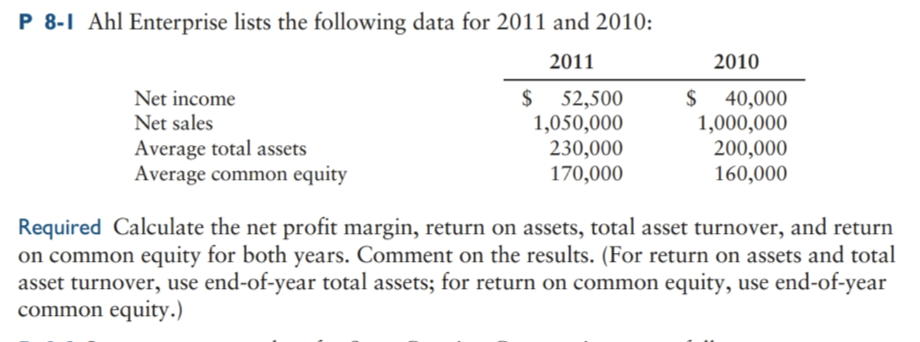
P 8-1 Ahl Enterprise lists the following data for 2011 and 2010: 2011 2010 Net income Net sales Average total assets Average common equity $

Step by Step Solution
There are 3 Steps involved in it
Step: 1

Get Instant Access to Expert-Tailored Solutions
See step-by-step solutions with expert insights and AI powered tools for academic success
Step: 2

Step: 3
Ace Your Homework with AI
Get the answers you need in no time with our AI-driven, step-by-step assistance
Get Started
Options Futures And Other Derivatives
Authors: John Hull
9th Global Edition
1292212896, 9781292212890