

Answered step by step
Verified Expert Solution
Question
1 Approved Answer
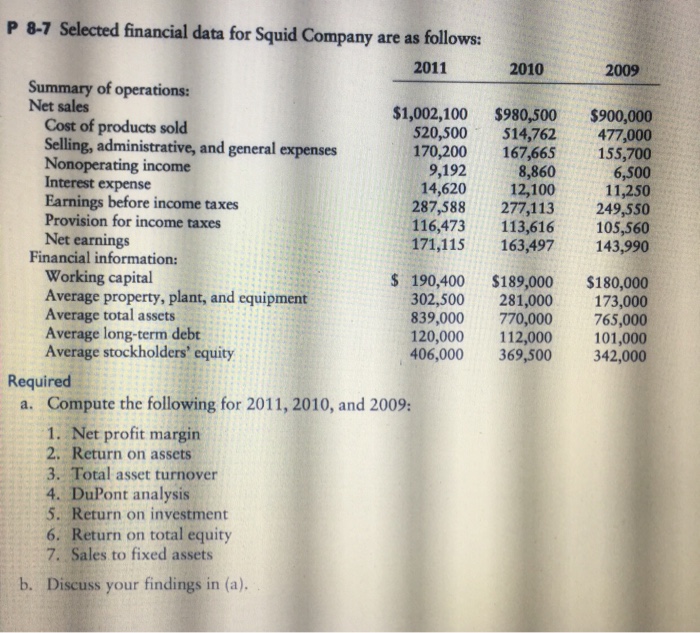
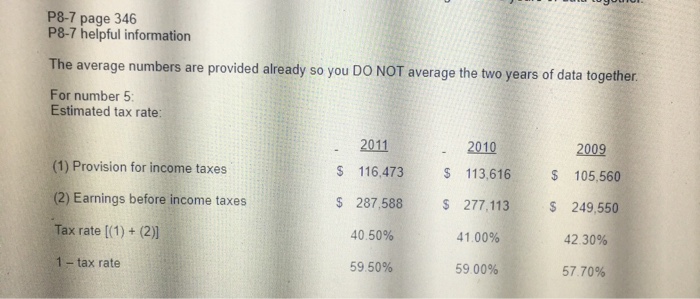
P 8-7 Selected financial data for Squid Company are as follows: 2011 2010 2009 Summary of operations: Net sales Cost of products sold Selling, administrative,
Step by Step Solution
There are 3 Steps involved in it
Step: 1

Get Instant Access to Expert-Tailored Solutions
See step-by-step solutions with expert insights and AI powered tools for academic success
Step: 2

Step: 3
Ace Your Homework with AI
Get the answers you need in no time with our AI-driven, step-by-step assistance
Get Started
The Evaluation Of An Internal Audit Department The Case Of SOTELMA
Authors: Oumar Bah
1st Edition
6204486039, 978-6204486031