P Chapter 7: The Sampling Distribution of the Sample Mean - Google Chrome X mylab.pearson.com/Student/PlayerTest.aspx?testld=252359588¢erwin=yes Data Visualization Tools and Techniques Section 2 - Spring 2023
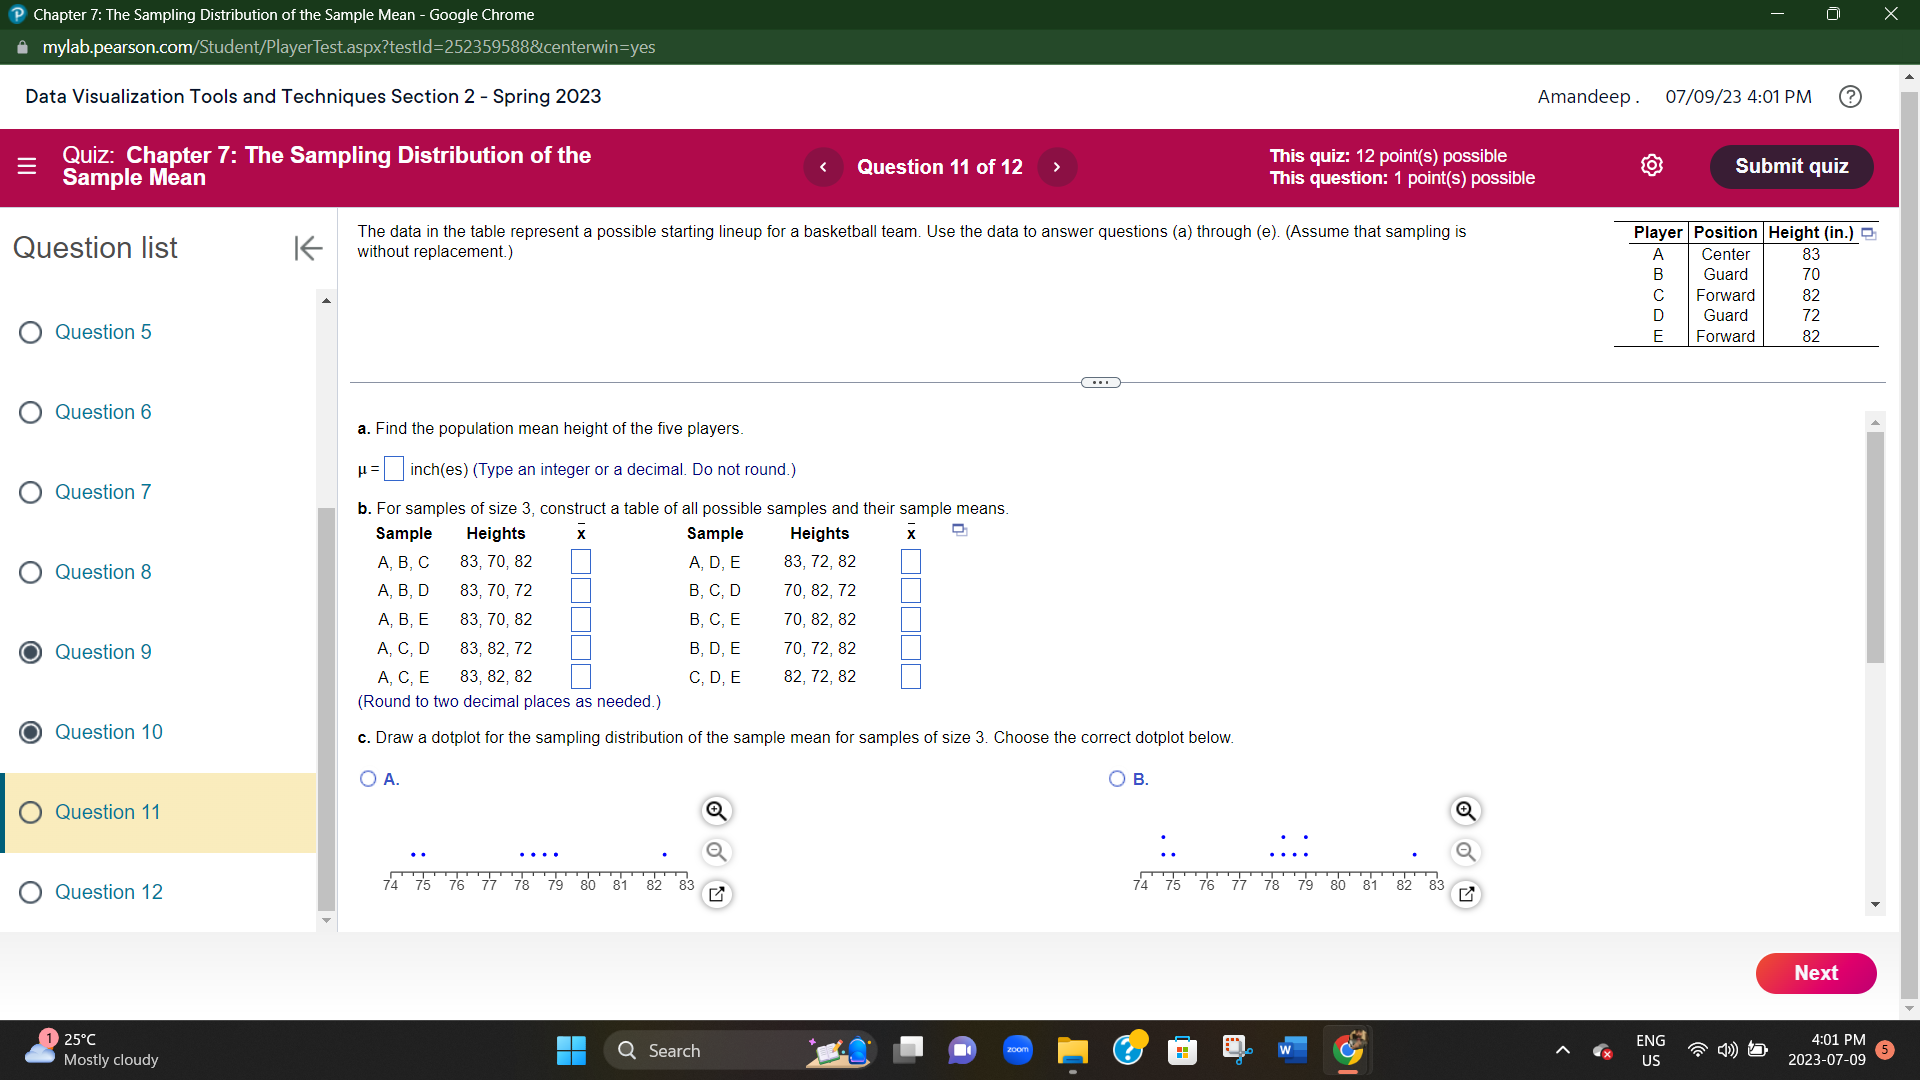
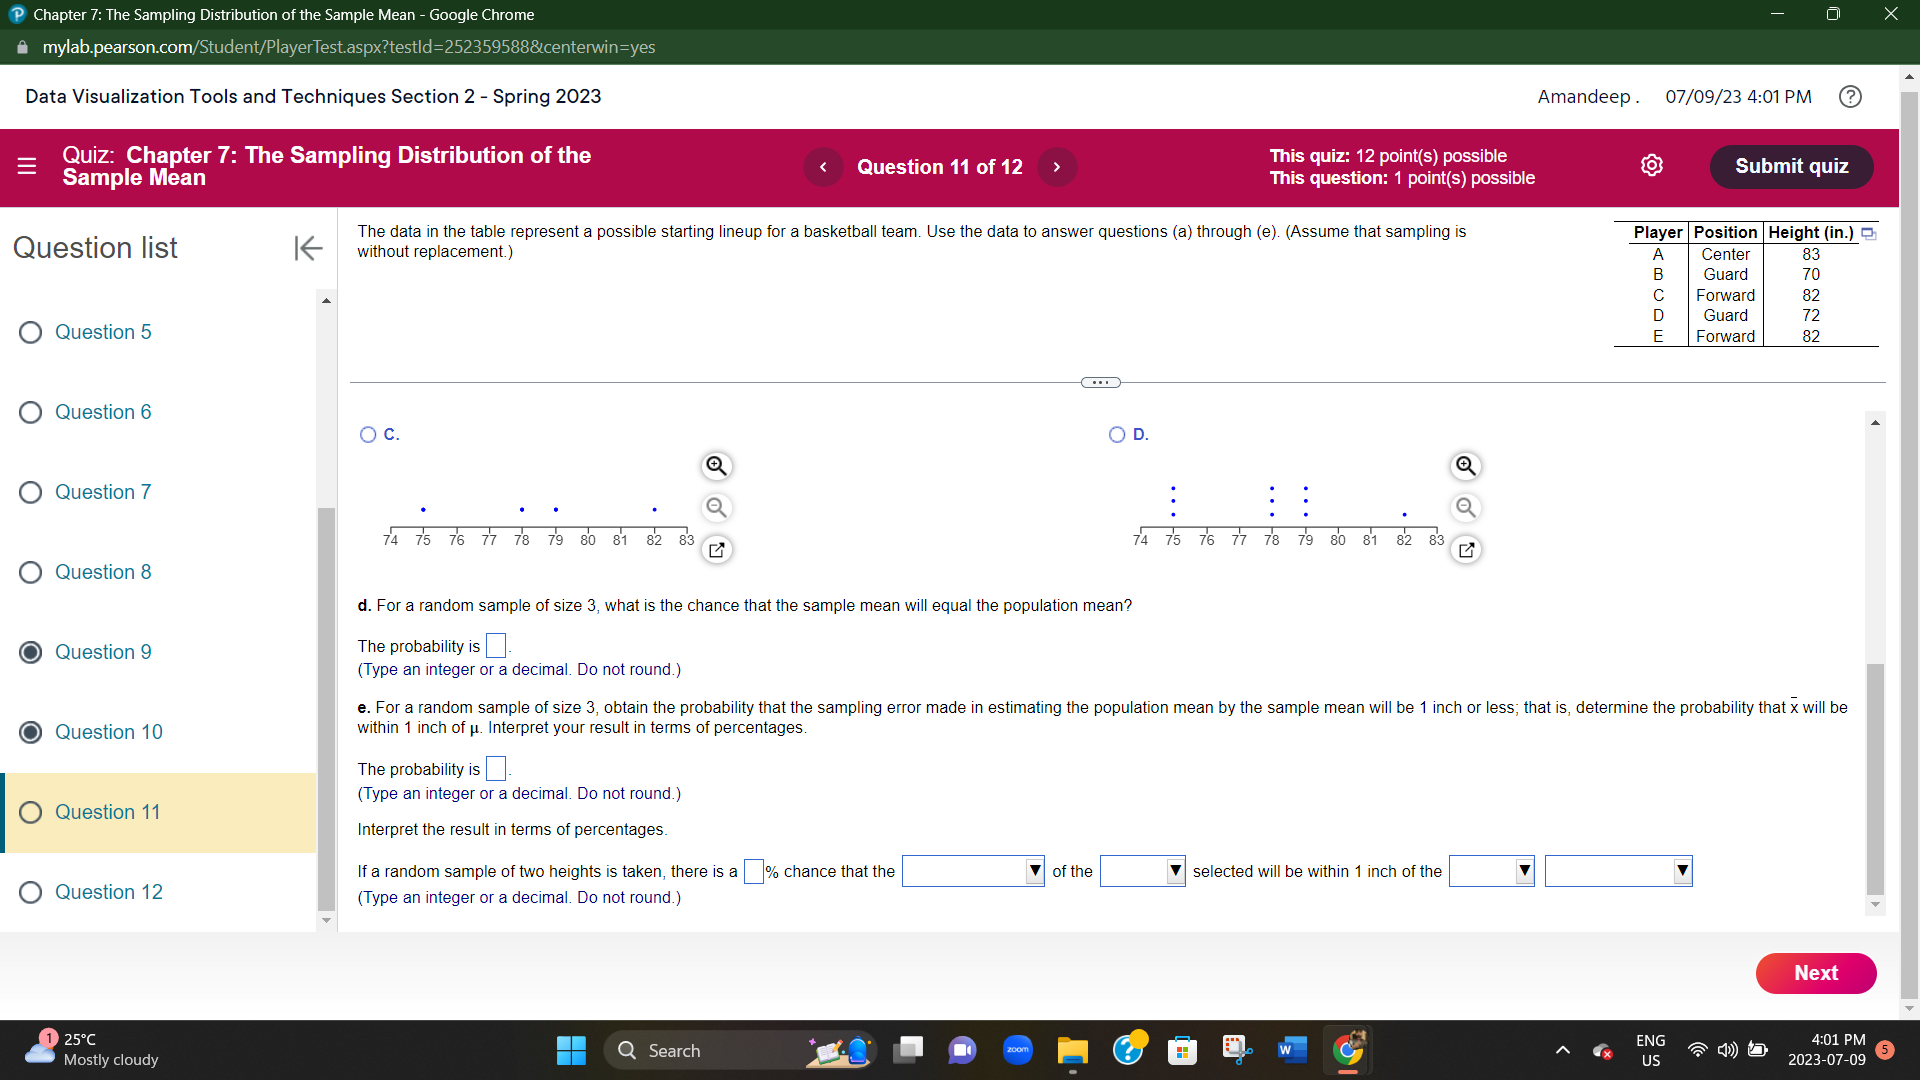
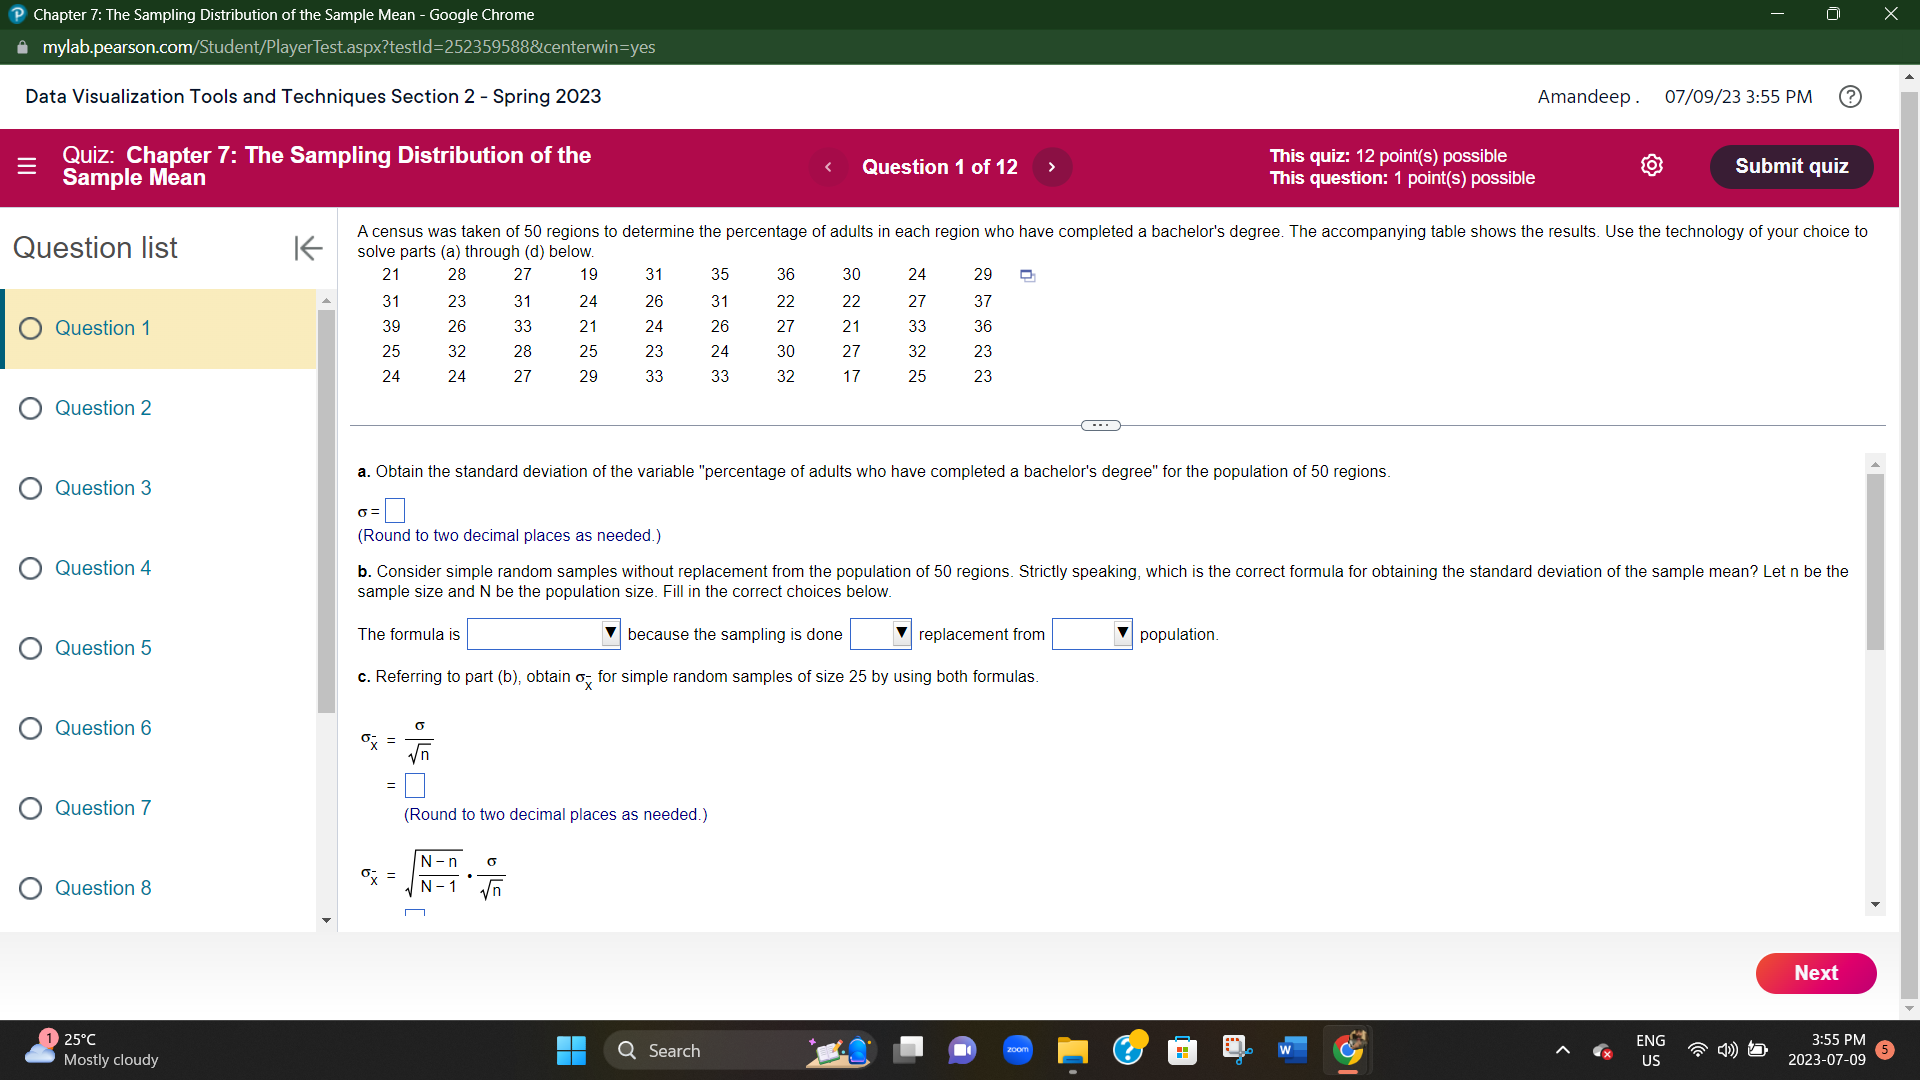
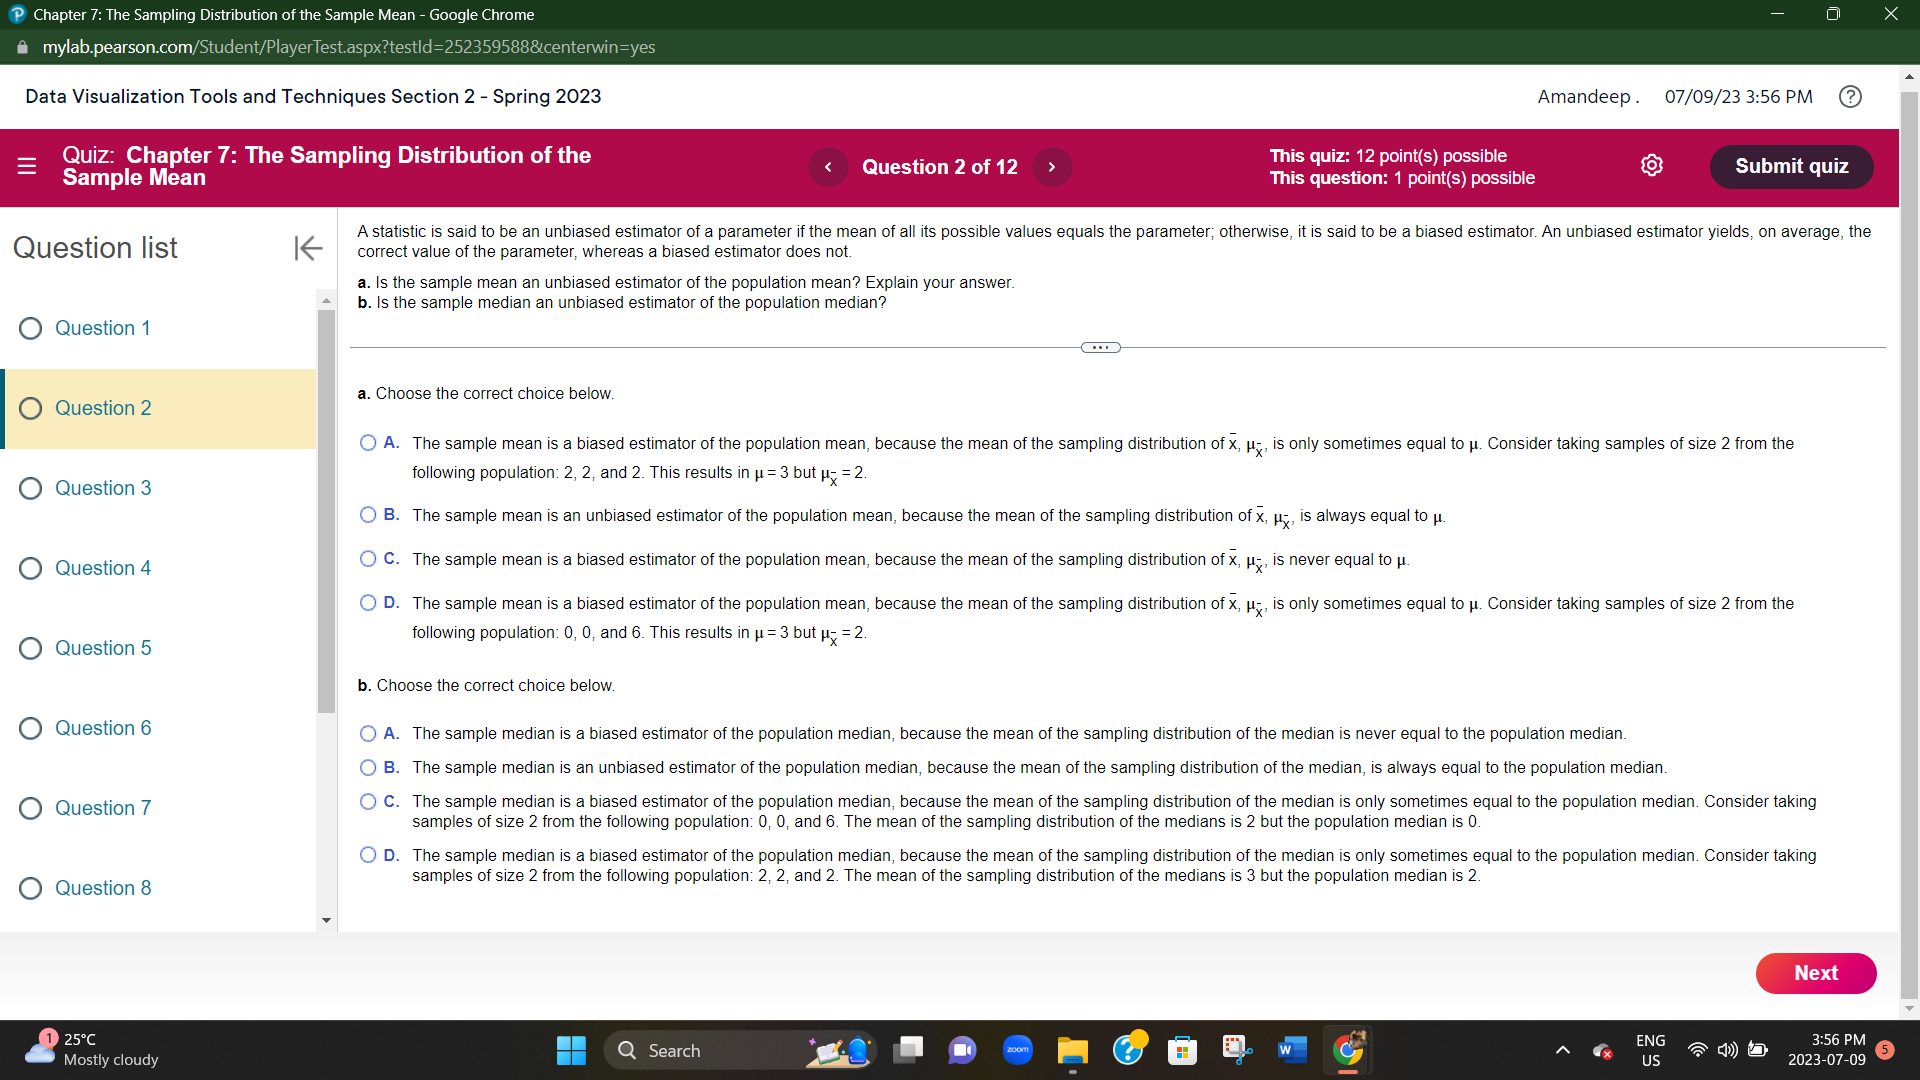
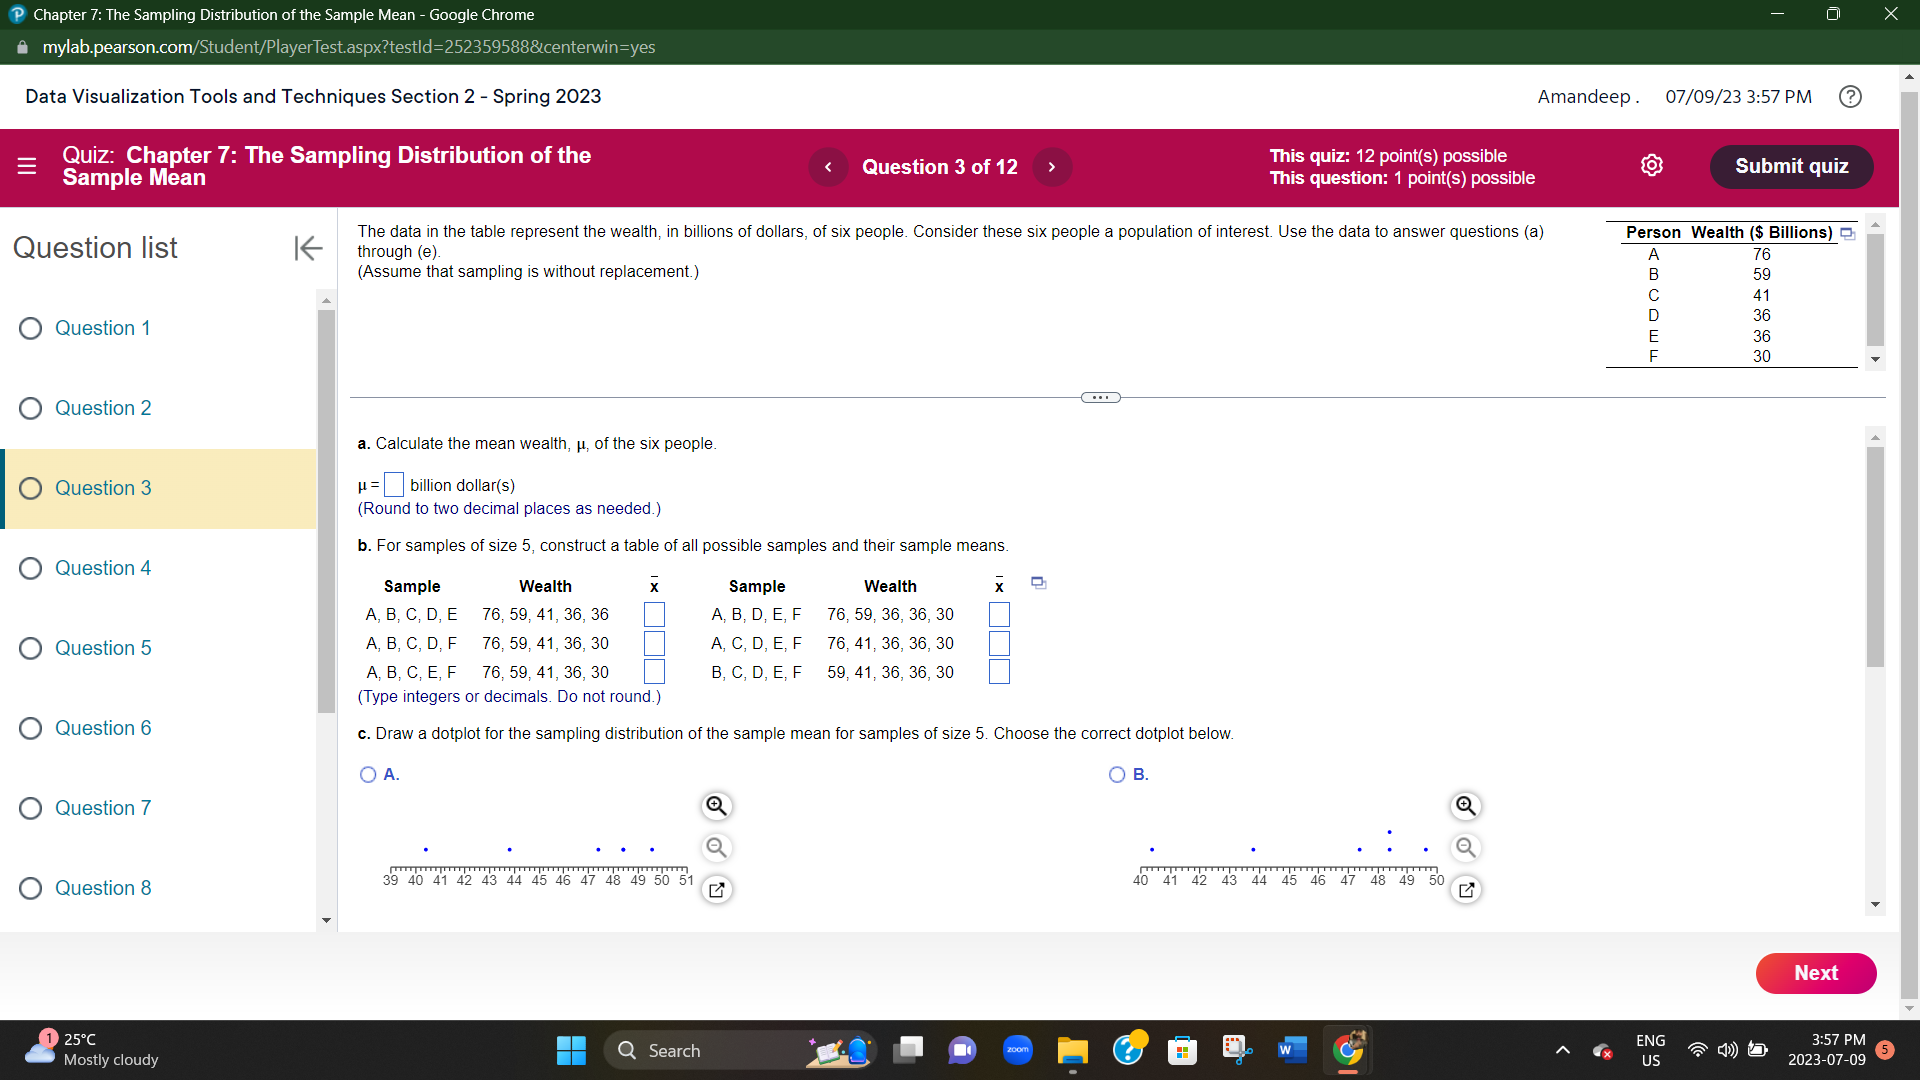
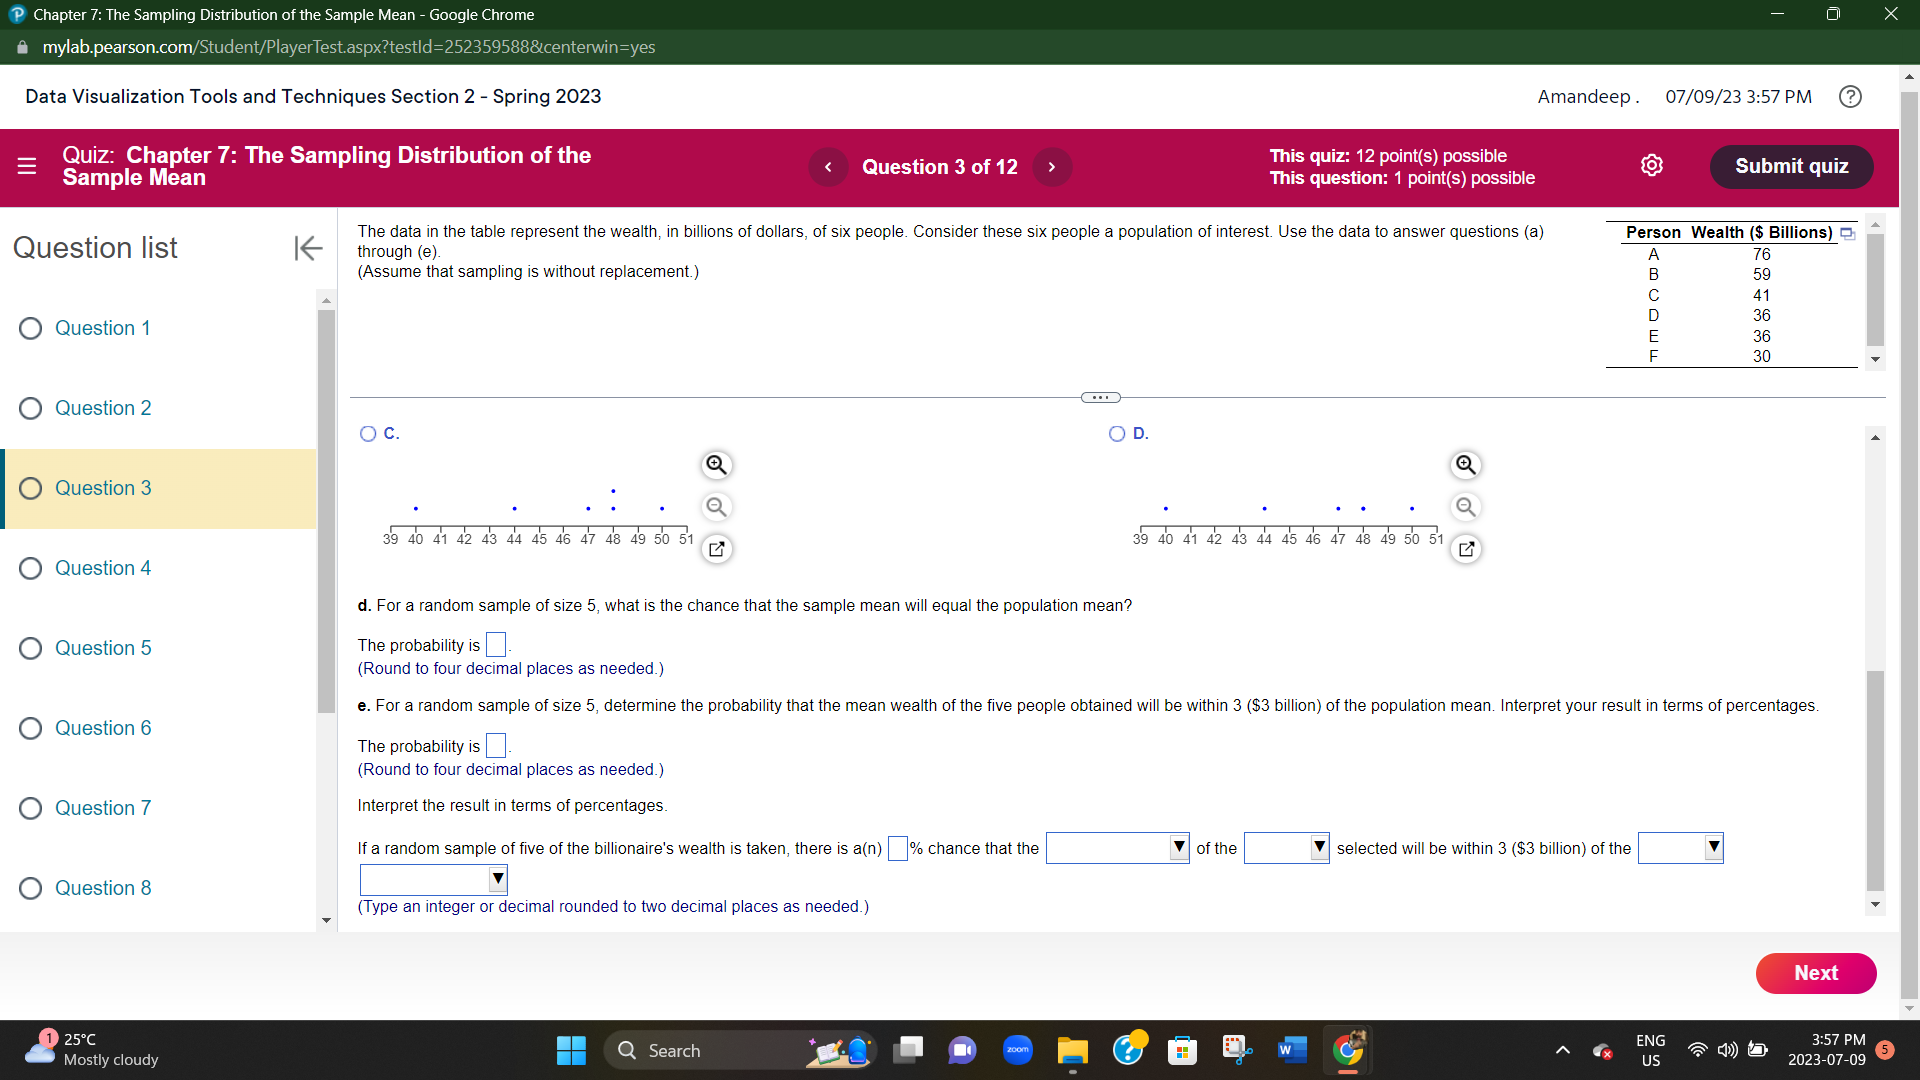
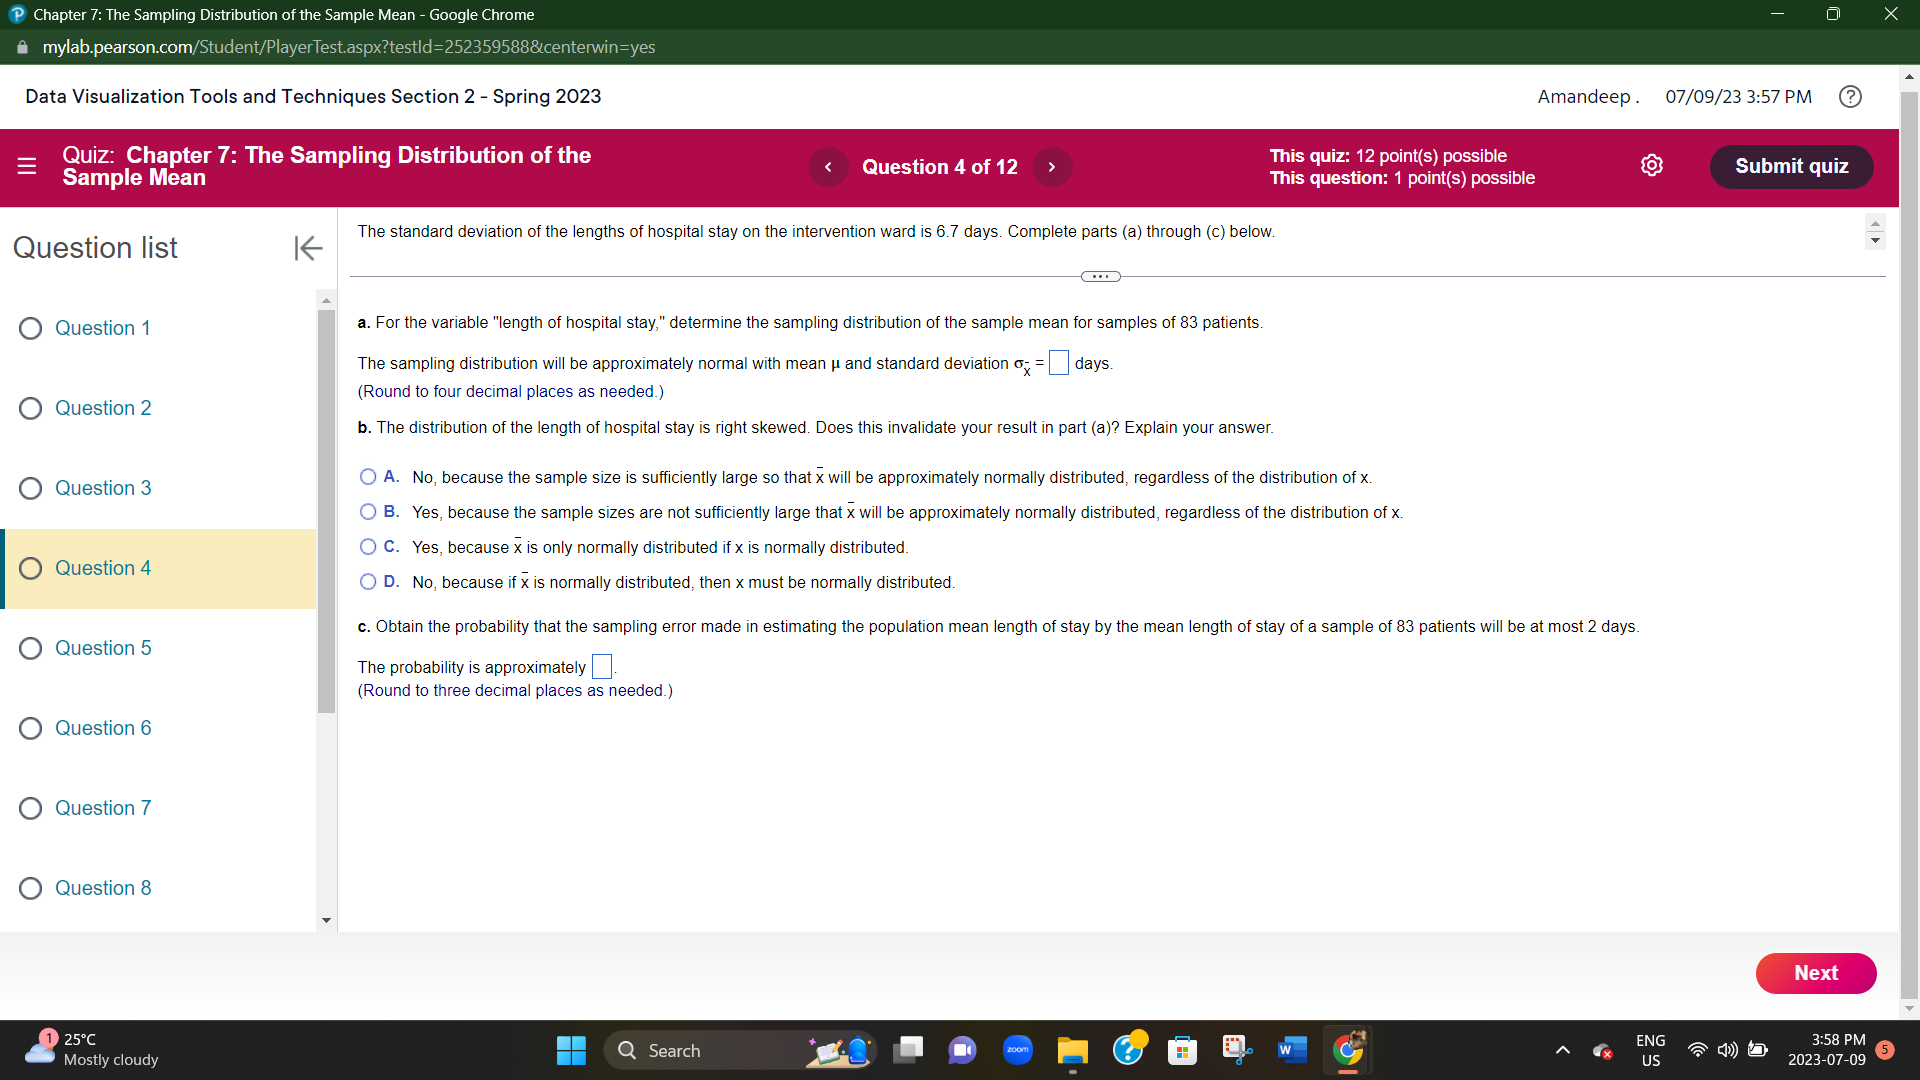
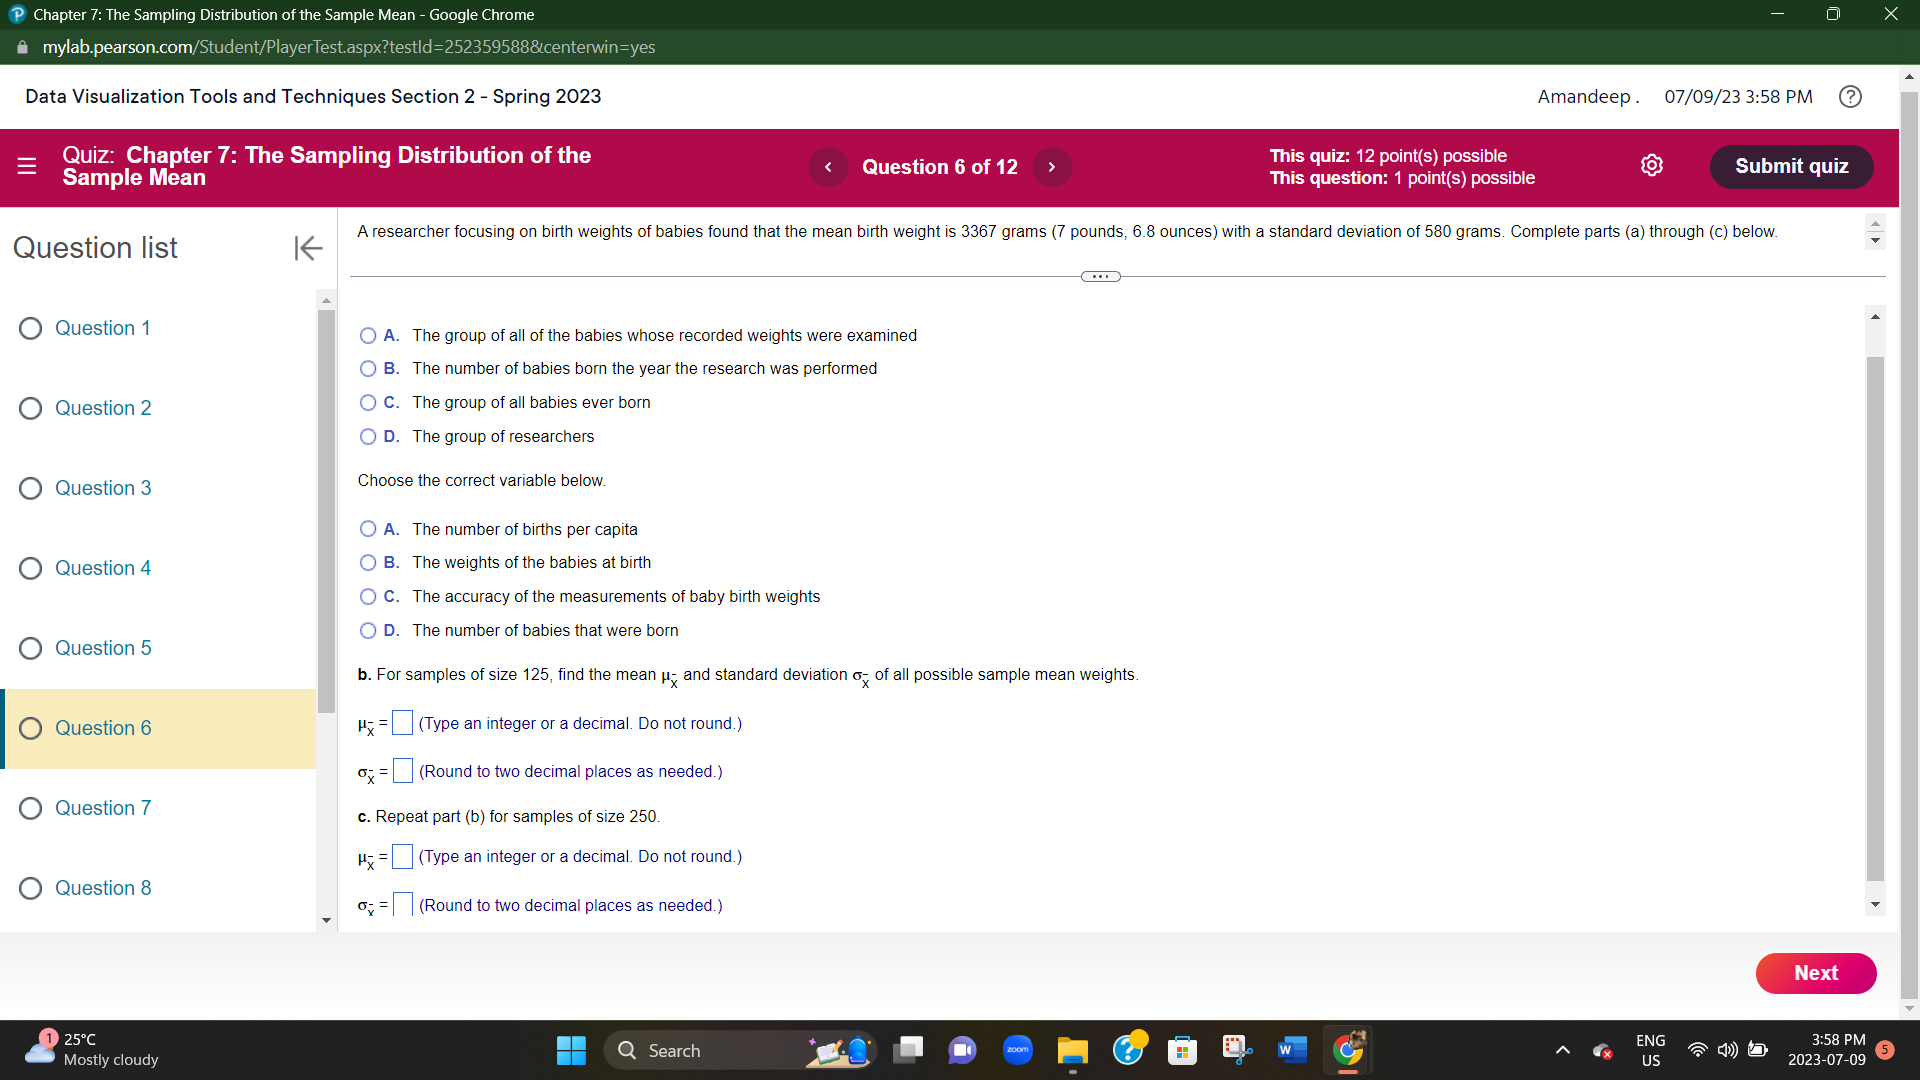
P Chapter 7: The Sampling Distribution of the Sample Mean - Google Chrome X mylab.pearson.com/Student/PlayerTest.aspx?testld=252359588¢erwin=yes Data Visualization Tools and Techniques Section 2 - Spring 2023 Amandeep . 07/09/23 4:01 PM E Quiz: Chapter 7: The Sampling Distribution of the This quiz: 12 point(s) possible Submit quiz Sample Mean Question 11 of 12 This question: 1 point(s) possible K The data in the table represent a possible starting lineup for a basketball team. Use the data to answer questions (a) through (e). (Assume that sampling is Player Position Height (in.) Question list without replacement.) Center 83 Guard 70 MOODI Forward 82 Guard 72 O Question 5 Forward 82 Question 6 a. Find the population mean height of the five players. H = inch(es) (Type an integer or a decimal. Do not round.) O Question 7 b. For samples of size 3, construct a table of all possible samples and their sample means. Sample Heights Sample Heights x O Question 8 A, B, C 83, 70, 82 A, D, E 83, 72, 82 A, B, D 83, 70, 72 B, C, D 70, 82, 72 1080Ox A B, E 83, 70, 82 B, C, E 70, 82, 82 0OOO Question 9 A CD 83, 82, 72 B, D, E 70, 72, 82 A, C, E 83, 82, 82 C, D, E 82, 72, 82 (Round to two decimal places as needed.) Question 10 c. Draw a dotplot for the sampling distribution of the sample mean for samples of size 3. Choose the correct dotplot below. O A. O B. Question 11 . . . . . . . . O Question 12 74 75 76 77 78 79 80 81 82 83 74 75 76 77 78 79 80 81 82 83 Next 1 25.C 200m W ENG 4:01 PM 5 Mostly cloudy Q Search US 2023-07-09P Chapter 7: The Sampling Distribution of the Sample Mean - Google Chrome X mylab.pearson.com/Student/PlayerTest.aspx?testld=252359588¢erwin=yes Data Visualization Tools and Techniques Section 2 - Spring 2023 Amandeep . 07/09/23 4:01 PM E Quiz: Chapter 7: The Sampling Distribution of the Question 11 of 12 This quiz: 12 point(s) possible Sample Mean This question: 1 point(s) possible Submit quiz Question list K The data in the table represent a possible starting lineup for a basketball team. Use the data to answer questions (a) through (e). (Assume that sampling is Player Position Height (in.) without replacement.) Center 83 Guard 70 moQUI Forward 82 Guard 72 O Question 5 Forward 82 Question 6 O c. OD. O Question 7 . . . . . . 4 75 76 77 78 79 80 81 82 83 74 75 76 77 78 79 80 81 82 83 O Question 8 d. For a random sample of size 3, what is the chance that the sample mean will equal the population mean? Question 9 The probability is (Type an integer or a decimal. Do not round.) e. For a random sample of size 3, obtain the probability that the sampling error made in estimating the population mean by the sample mean will be 1 inch or less; that is, determine the probability that x will be Question 10 within 1 inch of p. Interpret your result in terms of percentages The probability is. (Type an integer or a decimal. Do not round.) Question 11 Interpret the result in terms of percentages. If a random sample of two heights is taken, there is a % chance that the of the selected will be within 1 inch of the O Question 12 (Type an integer or a decimal. Do not round.) Next 1 25.C Mostly cloudy Q Search 200m W ENG 4:01 PM US 2023-07-09 5? apter 7: The Sampling Distribution ofthe Sample Mean , Google Chrome i mylab.pearson.comi"' i,iclent,s\"F'layeiT estld=2523 ' riterwln Data Visualization Tools and Techniques Section 2 - Spring 2023 Amandeep: 07/09/23 3:55 PM (3 Quiz: Chapter 7: The Sampling Distribution of the This quiz: 12 point(s) possible @ Sample Mean Question 1 0f 12 This question: 1 point(s) possible Submit quiz A census was taken of 50 regions to determine the percentage of adults in each region who have completed a bachelor's degree The accompanying table shows the results Use the technology of your choice to Question \"St '6 solve parts (a)through (d) below 2i 28 27 ie ai 35 36 30 24 29 :- 3i 23 3i 24 26 3i 22 22 27 37 0 Question 1 39 26 33 21 24 26 27 21 33 36 25 32 28 25 23 24 30 27 32 23 24 24 27 2Q 33 33 32 17 25 23 0 Question 2 . a. Obtain the standard deViation of the variable "percentage of adults who have completed a bachelor's degree" for the population of 50 regions 0 Question 3 a: (Round to two decimal places as needed) 0 Question 4 b. Consider simple random samples Without replacement from the population of 50 regions, Strictly speaking, which lS the correct formula for obtaining the standard deviation of the sample mean? Let n be the sample size and N be the population size, Fill in the correct choice: below, , The formula is V because the sampling is done V replacement from V population 0 Question 5 c. Referring to pan to) obtain a; for simple random samples of size 25 by using both formulas 0 Question 6 0 Question 7 0 Question 8 ? apter 7: The Sampling Distribution ofthe Sample Mean . Google Chrome i mylab.pearson.com.i\" tiderltliF'layeiT estld=2523 ' riter'i'l'ln Data Visualization Tools and Techniques Section 2 - Spring 2023 Amandeep. 07/09/23 3:56 PM (3 Quiz: Chapter 7: The Sampling Distribution of the Question 2 of 12 This quiz: 12 point(s) possible @ Sample Mean This question: 1 point(s) possible Smeit qUiz . , A statistic is said to be an unbiased estimator of a parameter if the mean of all its possible values equals the parameter otherWise. it is said to be a biased estimator An unbiased estimator yields on average. the QUeStIOn \"St '6 correct value oi the parameter whereas a biased estimator does not a. ls the sample mean an unbiased estimator of the population mean? Explain your answer. b. Is the sample median an unbiased estimator ol the population median? 0 Question 1 a. Choose the correct choice below 0 Question 2 fl A. The sample mean is a biased estimator of the population mean. because the mean oTtne sampling distribution 01;. \"Q. is only sometimes equal to In Consider taking samples ot size 2 from the . tollowmg population 2. 2' and 2 This results in p: 3 but \"2} = 2 0 Question 3 Cl B. The sample mean is an unbiased estimator of the population mean. because the mean oi the sampling distribution oli. pi. is always equal to p 0 Question 4 Cl C. The sample mean is a biased estimatorof the population mean. because the mean olthe sampling distribution DDT. \"$0 is neverequal to p [l D. The sample mean is a biased estimator of the population mean. because the mean olthe sampling distribution of)? \"$0 is only sometimes equal to p Consider taking samples of size 2 from the . folloWing population 0. 0 and 6 This results in p: 3 but \"it : 2 0 Question 5 b. Choose the correct choice below 0 Question 6 [l A. The sample median is a biased estimator ofthe population median. because the mean of the sampling distribution of the median is never equal to the population median. [l El. The sample median is an unbiased estimator of the population median. because the mean of the sampling distribution of the median. is always equal to the population median. 0 Question 7 [l C. The sample median is a biased estimator of the population median. because the mean of the sampling distribution of the median is only sometimes equal to the population median Consider taking samples of size 2 from the tollowmg population 0 0. and 6 The mean of the sampling distribution of the medians is 2 but the population median is 0 [l D. The sample median is a biased estimator of the population median. because the mean of the sampling distribution of the median is only sometimes equal to the population median Consider taking 0 Question 8 samples of size 2 from the tollowmg population 2 2. and 2 The mean of the sampling distribution of the medians is 3 but the population median is 2 P Chapter 7: The Sampling Distribution of the Sample Mean - Google Chrome X mylab.pearson.com/Student/PlayerTest.aspx?testld=252359588¢erwin=yes Data Visualization Tools and Techniques Section 2 - Spring 2023 Amandeep . 07/09/23 3:57 PM E Quiz: Chapter 7: The Sampling Distribution of the
Step by Step Solution
There are 3 Steps involved in it
Step: 1
Get Instant Access to Expert-Tailored Solutions
See step-by-step solutions with expert insights and AI powered tools for academic success
Step: 2
Step: 3
Ace Your Homework with AI
Get the answers you need in no time with our AI-driven, step-by-step assistance