

Answered step by step
Verified Expert Solution
Question
1 Approved Answer
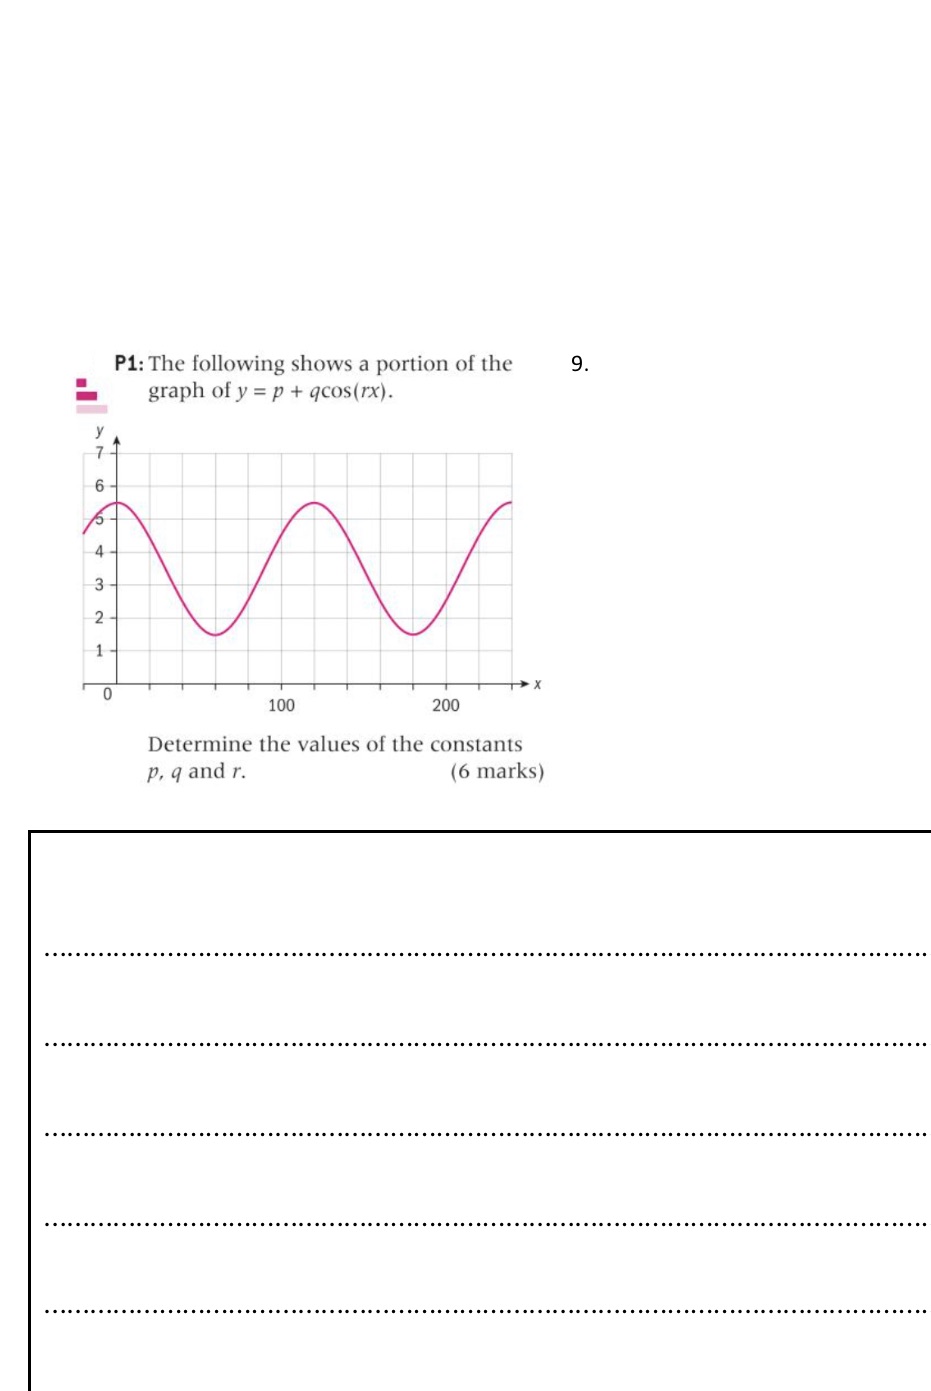
P1: The following shows a portion of the 9 . graph of y = p + qcos(rx). 100 200 Determine the values of the constants

Step by Step Solution
There are 3 Steps involved in it
Step: 1

Get Instant Access to Expert-Tailored Solutions
See step-by-step solutions with expert insights and AI powered tools for academic success
Step: 2

Step: 3
Ace Your Homework with AI
Get the answers you need in no time with our AI-driven, step-by-step assistance
Get Started
A Handbook Of Statistical Analyses Using Sas
Authors: Geoff Der, Brian S Everitt
3rd Edition
1584887850, 9781584887850