

Answered step by step
Verified Expert Solution
Question
1 Approved Answer
P10-3 (similar to Question Help The figure in the popup window, shows the one-year return distribution for RCS stock. The table below shows the one-year
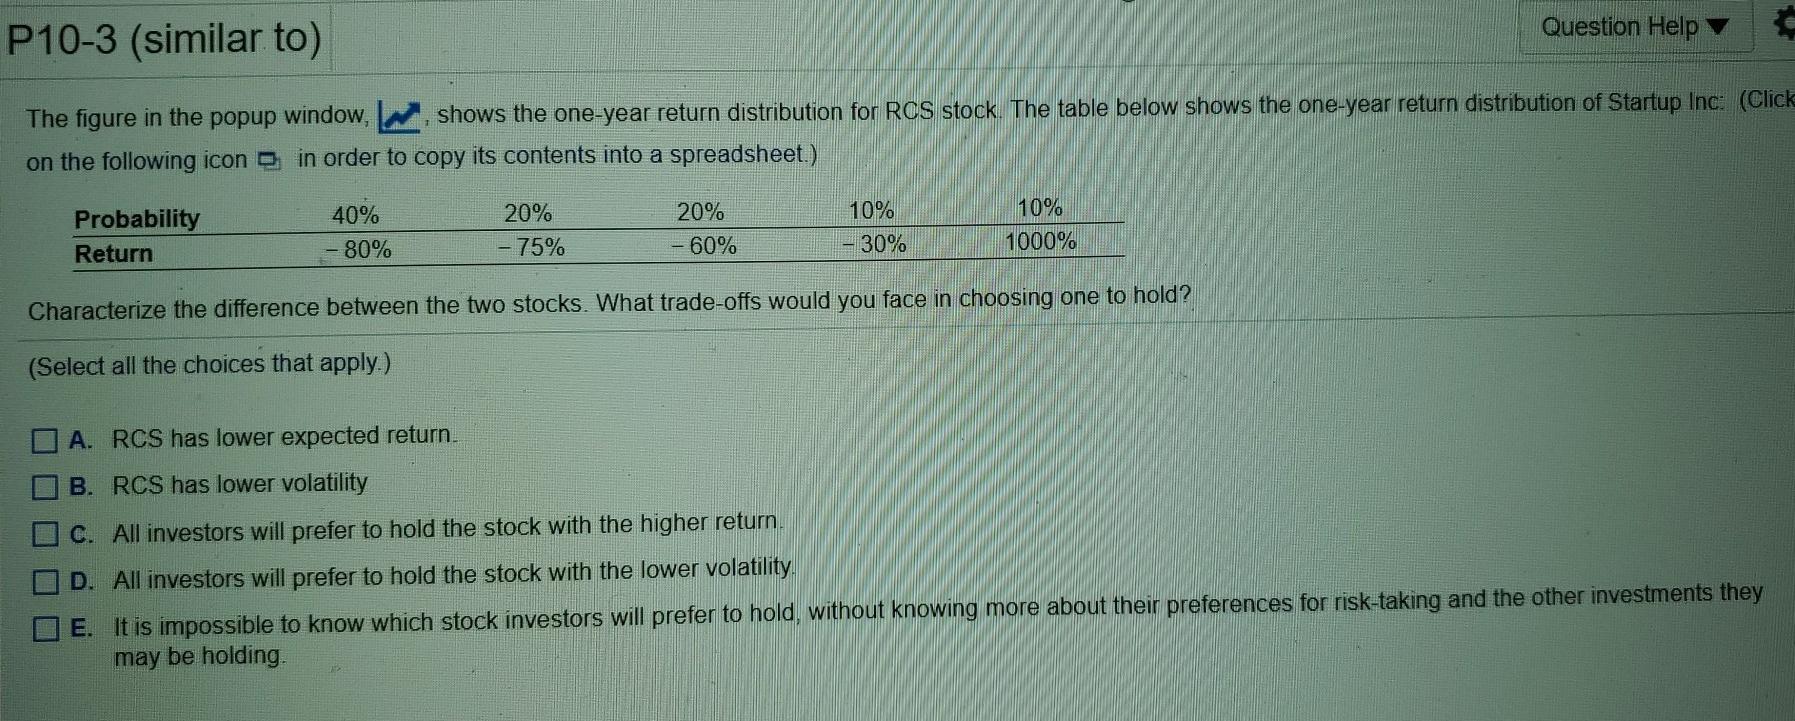
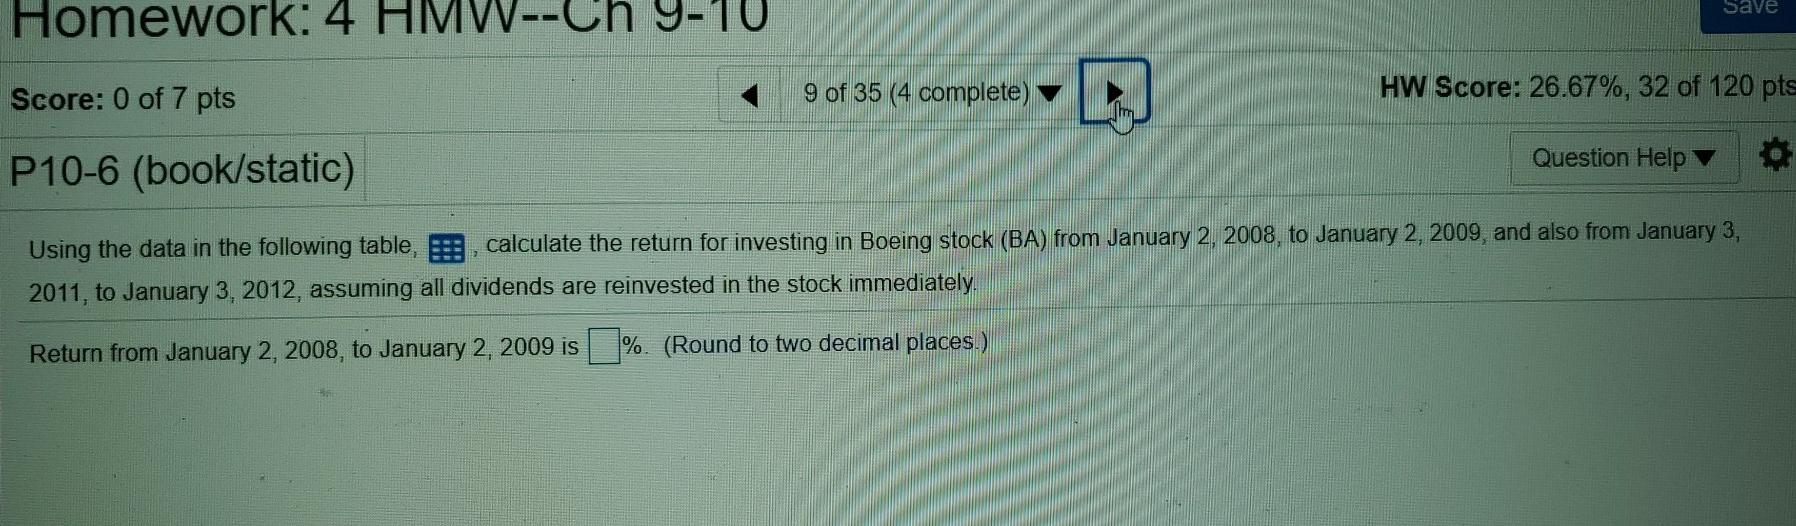
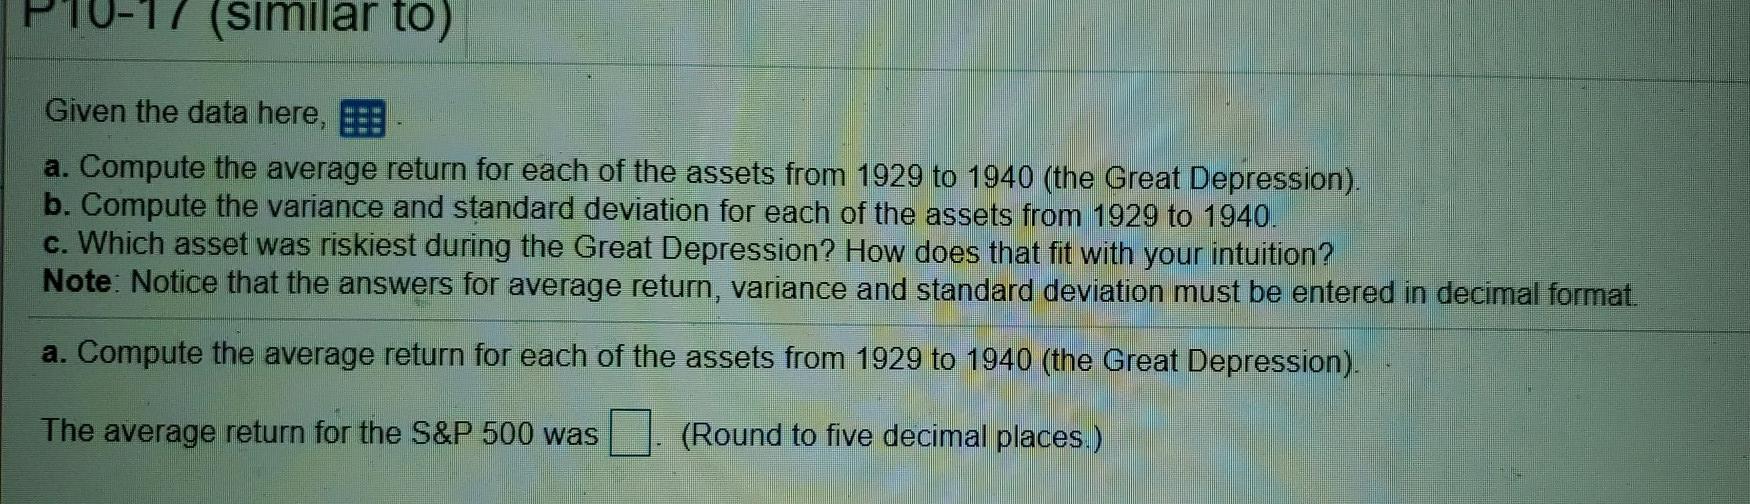
P10-3 (similar to Question Help The figure in the popup window, shows the one-year return distribution for RCS stock. The table below shows the one-year return distribution of Startup Inc. (Click on the following icon in order to copy its contents into a spreadsheet.) 40% Probability Return 20% - 75% 20% - 60% 10% 30% 10% 1000% - 80% Characterize the difference between the two stocks. What trade-offs would you face in choosing one to hold? (Select all the choices that apply.) A. RCS has lower expected return. B. RCS has lower volatility C. All investors will prefer to hold the stock with the higher return. D. All investors will prefer to hold the stock with the lower volatility E. It is impossible to know which stock investors will prefer to hold, without knowing more about their preferences for risk-taking and the other investments they may be holding Save Homework: 4 HMW--Ch 9-10 Score: 0 of 7 pts 9 of 35 (4 complete) HW Score: 26.67%, 32 of 120 pts P10-6 (book/static) Question Help 2 Using the data in the following table, calculate the return for investing in Boeing stock (BA) from January 2, 2008, to January 2, 2009, and also from January 3, 2011, to January 3, 2012, assuming all dividends are reinvested in the stock immediately. Return from January 2, 2008, to January 2, 2009 is 1%. (Round to two decimal places.) (similar to) Given the data here, a. Compute the average return for each of the assets from 1929 to 1940 (the Great Depression). b. Compute the variance and standard deviation for each of the assets from 1929 to 1940. c. Which asset was riskiest during the Great Depression? How does that fit with your intuition? Note: Notice that the answers for average return, variance and standard deviation must be entered in decimal format. a. Compute the average return for each of the assets from 1929 to 1940 (the Great Depression). The average return for the S&P 500 was (Round to five decimal places.) P10-3 (similar to Question Help The figure in the popup window, shows the one-year return distribution for RCS stock. The table below shows the one-year return distribution of Startup Inc. (Click on the following icon in order to copy its contents into a spreadsheet.) 40% Probability Return 20% - 75% 20% - 60% 10% 30% 10% 1000% - 80% Characterize the difference between the two stocks. What trade-offs would you face in choosing one to hold? (Select all the choices that apply.) A. RCS has lower expected return. B. RCS has lower volatility C. All investors will prefer to hold the stock with the higher return. D. All investors will prefer to hold the stock with the lower volatility E. It is impossible to know which stock investors will prefer to hold, without knowing more about their preferences for risk-taking and the other investments they may be holding Save Homework: 4 HMW--Ch 9-10 Score: 0 of 7 pts 9 of 35 (4 complete) HW Score: 26.67%, 32 of 120 pts P10-6 (book/static) Question Help 2 Using the data in the following table, calculate the return for investing in Boeing stock (BA) from January 2, 2008, to January 2, 2009, and also from January 3, 2011, to January 3, 2012, assuming all dividends are reinvested in the stock immediately. Return from January 2, 2008, to January 2, 2009 is 1%. (Round to two decimal places.) (similar to) Given the data here, a. Compute the average return for each of the assets from 1929 to 1940 (the Great Depression). b. Compute the variance and standard deviation for each of the assets from 1929 to 1940. c. Which asset was riskiest during the Great Depression? How does that fit with your intuition? Note: Notice that the answers for average return, variance and standard deviation must be entered in decimal format. a. Compute the average return for each of the assets from 1929 to 1940 (the Great Depression). The average return for the S&P 500 was (Round to five decimal places.)
Step by Step Solution
There are 3 Steps involved in it
Step: 1

Get Instant Access to Expert-Tailored Solutions
See step-by-step solutions with expert insights and AI powered tools for academic success
Step: 2

Step: 3
Ace Your Homework with AI
Get the answers you need in no time with our AI-driven, step-by-step assistance
Get Started
The Future Of Finance After SEPA
Authors: Chris Skinner
1st Edition
9780470987827