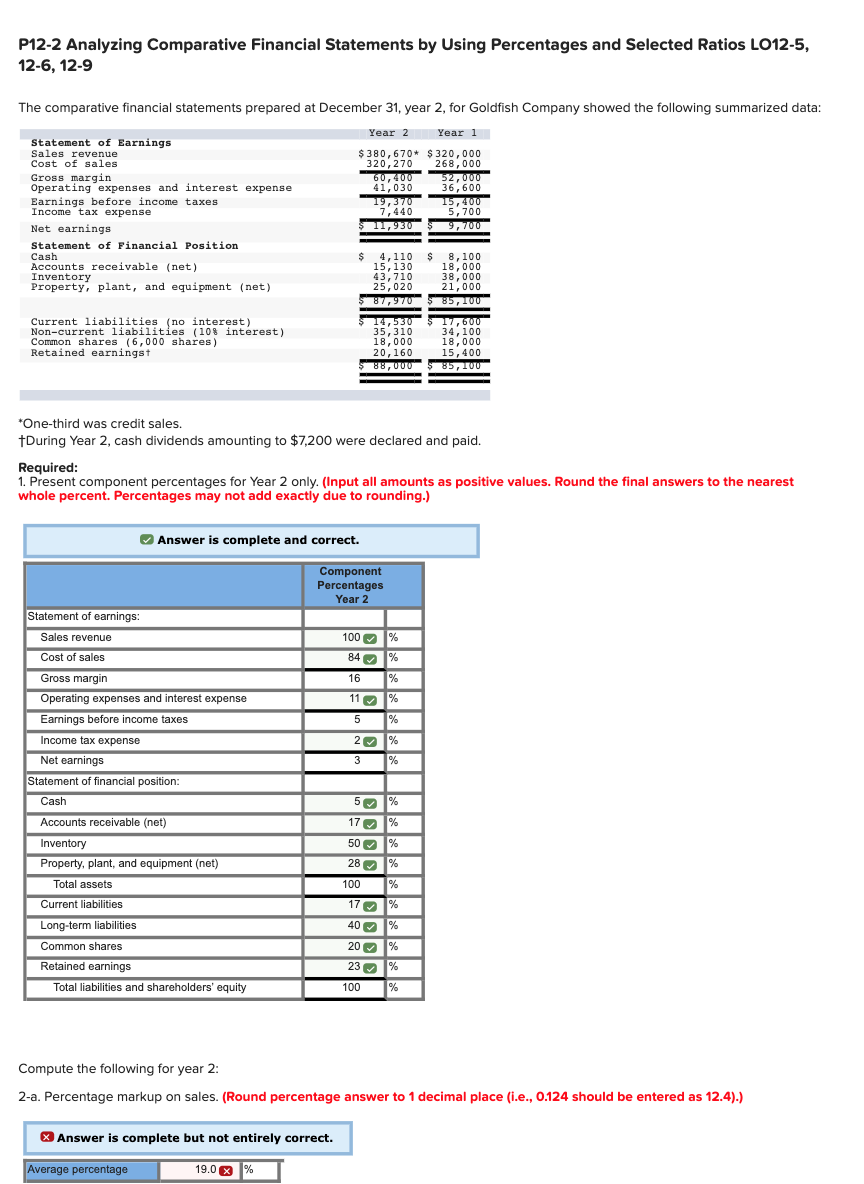
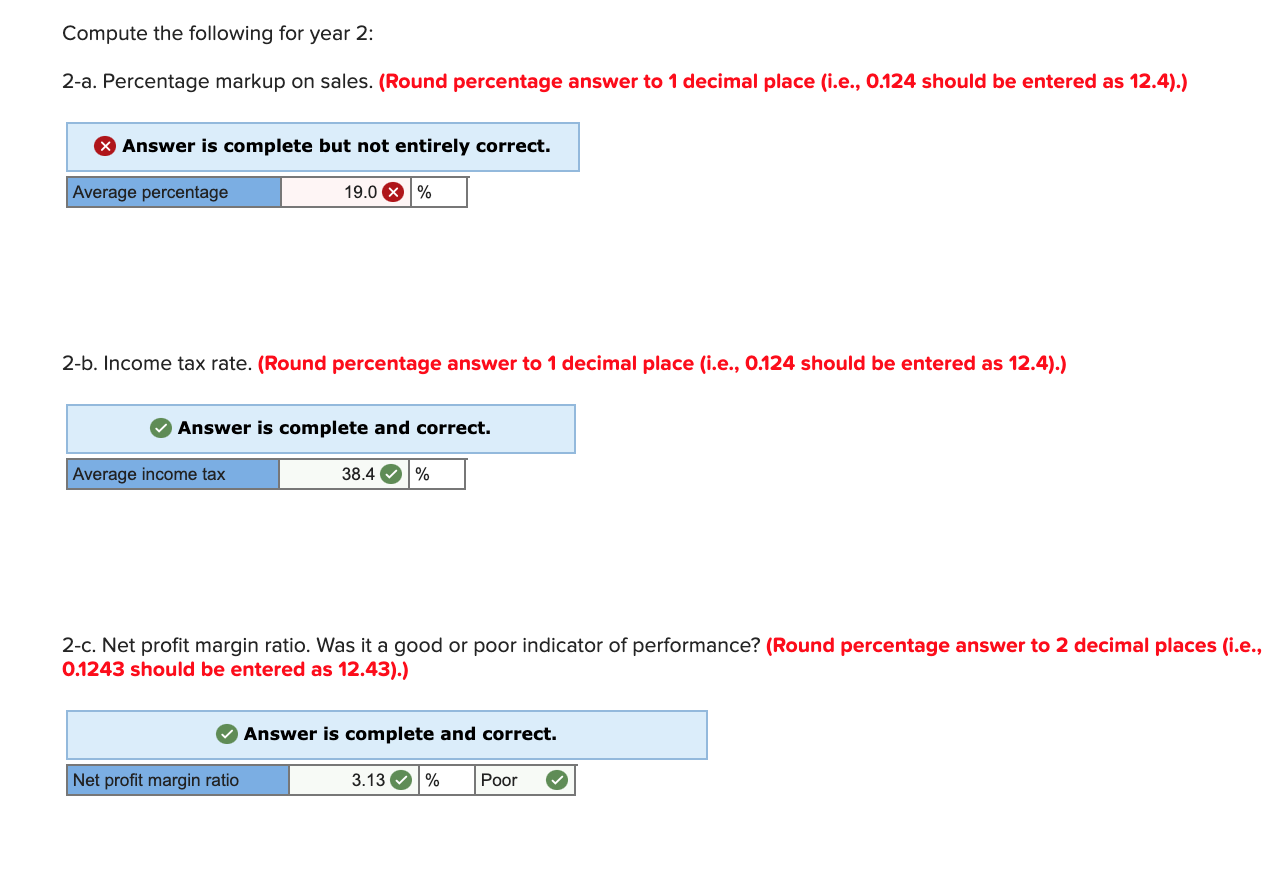
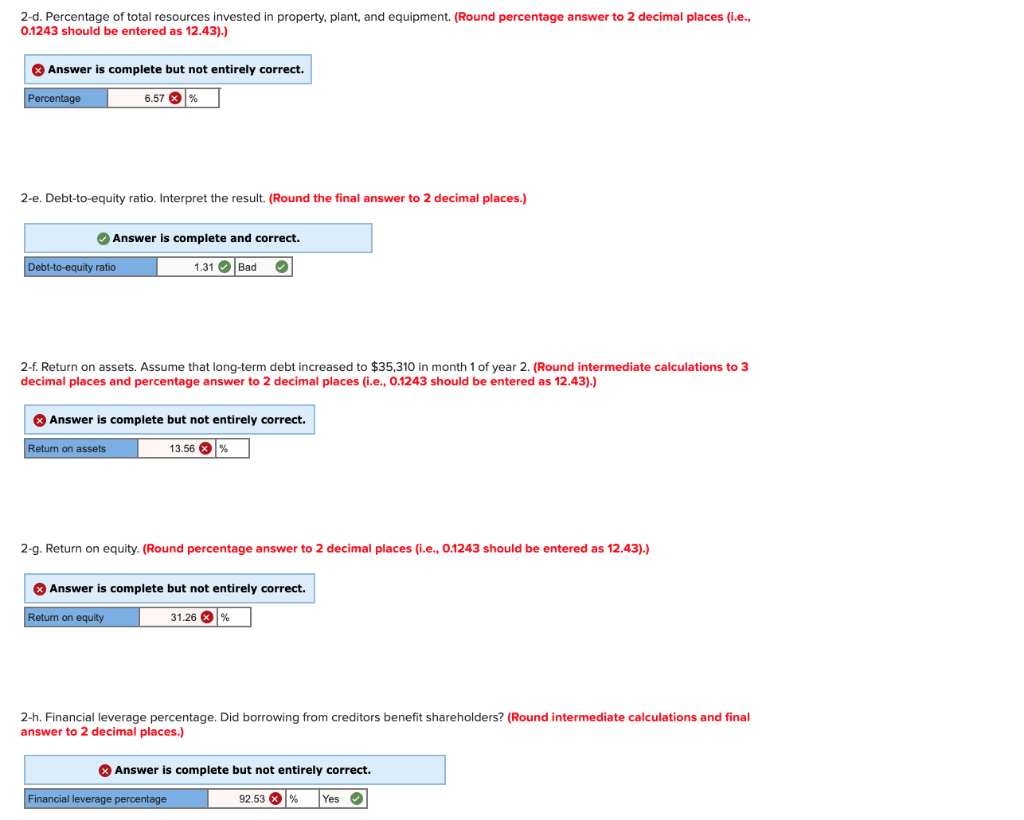
P12-2 Analyzing Comparative Financial Statements by Using Percentages and Selected Ratios LO12-5, 12-6, 12-9 The comparative financial statements prepared at December 31, year 2, for Goldfish Company showed the following summarized data: Year 2 Year 1 Statement of Earnings Sales revenue $380, 670# $ 320,000 Cost of sales 320,270 268,000 Gross margin 60,400 52,000 Operating expenses and interest expense 41,030 36,600 Earnings before income taxes 19,370 15,400 Income tax expense 7, 440 5,700 Net earnings 11,930 Statement of Financial Position Cash $ 4,110 $ 8,100 Accounts receivable (net) 15, 130 18,000 Inventory 43, 710 38,000 Property, plant, and equipment (net) 25,020 21,000 $ 87,970 $ 85, TUU Current liabilities (no interest) 14,530" $17,600 Non-current liabilities (10% interest) 35, 310 34,100 Common shares (6,000 shares) 18,000 18,000 Retained earningst 20,160 15, 400 88,000 85,100 S *One-third was credit sales. During Year 2, cash dividends amounting to $7,200 were declared and paid. Required: 1. Present component percentages for Year 2 only. (Input all amounts as positive values. Round the final answers to the nearest whole percent. Percentages may not add exactly due to rounding.) Answer is complete and correct. Component Percentages Year 2 100 % 84 % 16 % 11% 5 % 2 % 3 % Statement of earnings: : Sales revenue Cost of sales Gross margin Operating expenses and interest expense Earnings before income taxes Income tax expense Net earnings Statement of financial position: Cash Accounts receivable (net) Inventory Property, plant, and equipment (net) Total assets Current liabilities Long-term liabilities Common shares 5 % 17 % 50 % 28 % 100 % 17% 40 % 20% % 23 % 100 % Retained earnings Total liabilities and shareholders' equity Compute the following for year 2: 2-a. Percentage markup on sales. (Round percentage answer to 1 decimal place (i.e., 0.124 should be entered as 12.4).) Answer is complete but not entirely correct. Average percentage 19.0 % Compute the following for year 2: 2-a. Percentage markup on sales. (Round percentage answer to 1 decimal place (i.e., 0.124 should be entered as 12.4).) Answer is complete but not entirely correct. Average percentage 19.0 % 2-b. Income tax rate. (Round percentage answer to 1 decimal place (i.e., 0.124 should be entered as 12.4).) Answer is complete and correct. Average income tax 38.4 % 2-c. Net profit margin ratio. Was it a good or poor indicator of performance? (Round percentage answer to 2 decimal places (i.e., 0.1243 should be entered as 12.43).) Answer is complete and correct. Net profit margin ratio 3.13 % Poor 2-d. Percentage of total resources invested in property, plant, and equipment. (Round percentage answer to 2 decimal places (i.e., 0.1243 should be entered as 12.43).) Answer is complete but not entirely correct. Percentage 6.57 % 2-e. Debt-to-equity ratio. Interpret the result. (Round the final answer to 2 decimal places.) Answer is complete and correct. Debt-to-equity ratio 1.31 Bad 2-f. Return on assets. Assume that long-term debt increased to $35,310 in month 1 of year 2. (Round intermediate calculations to 3 decimal places and percentage answer to 2 decimal places (.e., 0.1243 should be entered as 12.43).) Answer is complete but not entirely correct. Return on assets 13.56 % 2-g. Return on equity. (Round percentage answer to 2 decimal places (.e., 0.1243 should be entered as 12.43).) Answer is complete but not entirely correct. Return on equity 31.26% 2-h. Financial leverage percentage. Did borrowing from creditors benefit shareholders? (Round intermediate calculations and final answer to 2 decimal places.) Answer is complete but not entirely correct. Financial leverage percentage 92.53 % Yes