

Answered step by step
Verified Expert Solution
Question
1 Approved Answer
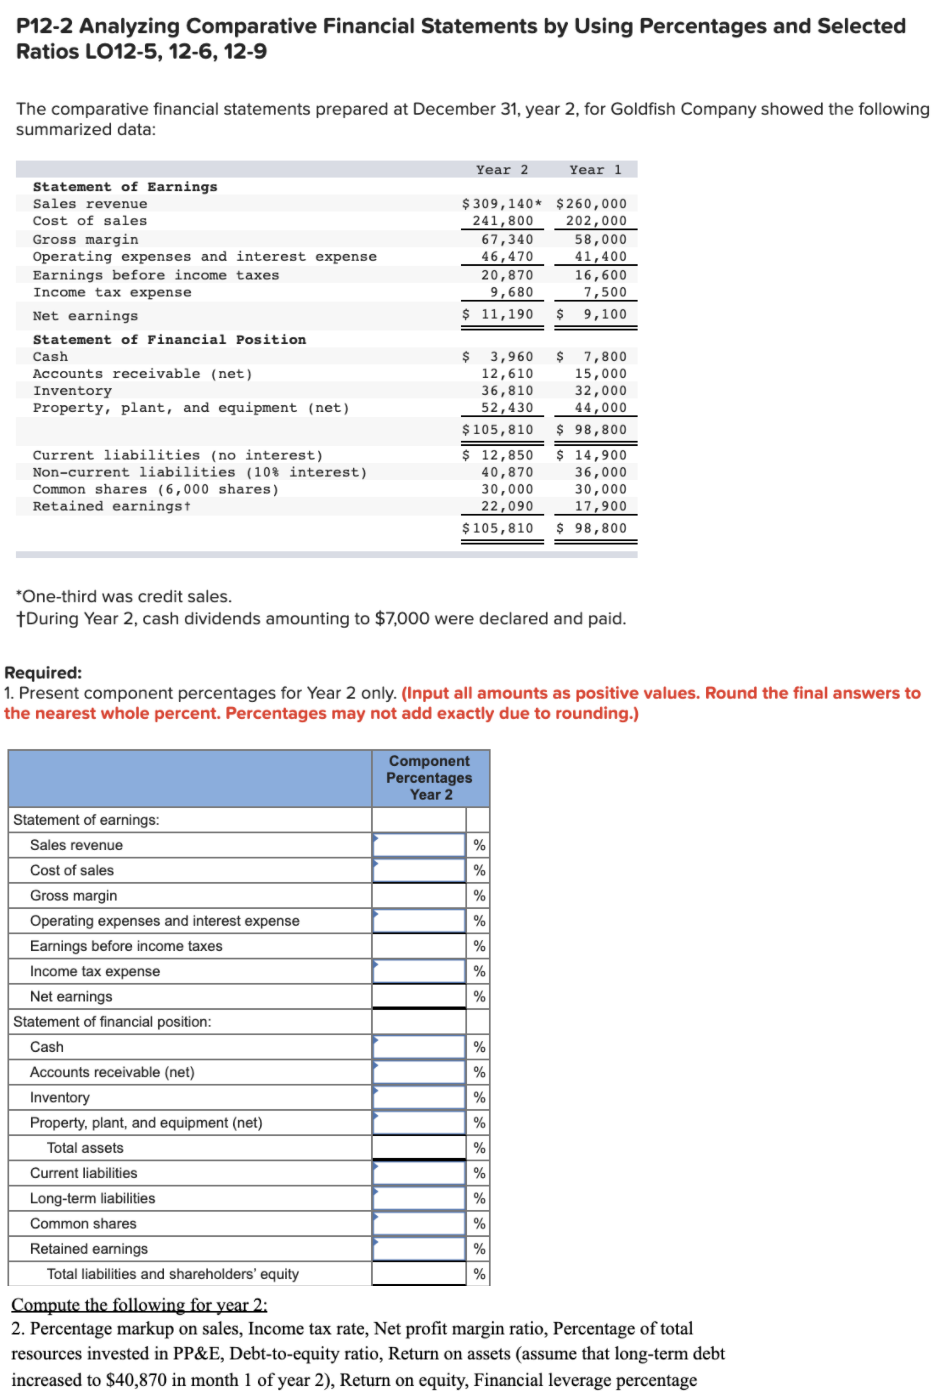
P12-2 Analyzing Comparative Financial Statements by Using Percentages and Selected Ratios LO12-5, 12-6, 12-9 The comparative financial statements prepared at December 31, year 2, for
Step by Step Solution
There are 3 Steps involved in it
Step: 1

Get Instant Access to Expert-Tailored Solutions
See step-by-step solutions with expert insights and AI powered tools for academic success
Step: 2

Step: 3
Ace Your Homework with AI
Get the answers you need in no time with our AI-driven, step-by-step assistance
Get Started
Payroll Accounting 2020
Authors: Jeanette Landin
6th Edition
1260247961, 9781260247961