

Answered step by step
Verified Expert Solution
Question
1 Approved Answer
P17-7A The following are the financial statements of Nosker Company. NOSKER COMPANY Comparative Balance Sheets December 31 Assets Cash Accounts receivable Inventory Equipment Accumulated
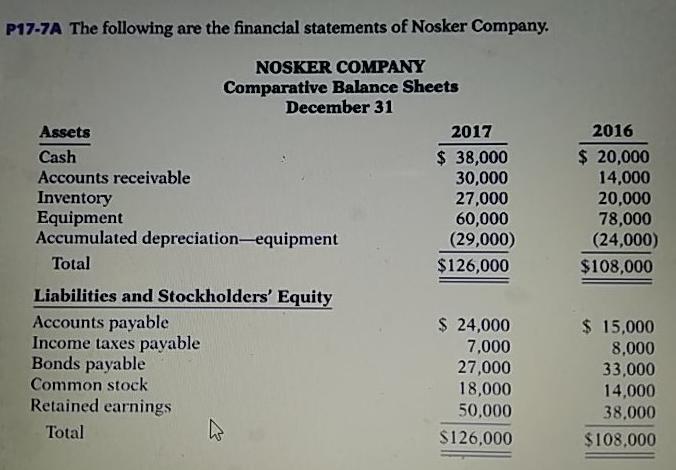

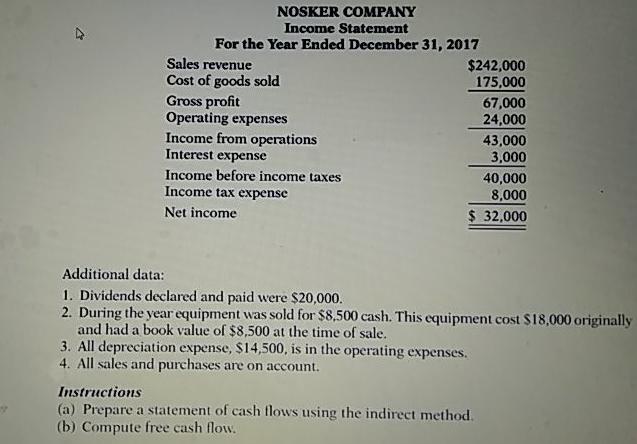
P17-7A The following are the financial statements of Nosker Company. NOSKER COMPANY Comparative Balance Sheets December 31 Assets Cash Accounts receivable Inventory Equipment Accumulated depreciation-equipment Total Liabilities and Stockholders' Equity Accounts payable Income taxes payable Bonds payable Common stock Retained earnings Total 2017 $ 38,000 2016 $ 20,000 30,000 14,000 27,000 20,000 60,000 78,000 (29,000) (24,000) $126,000 $108,000 $ 24,000 $ 15,000 7,000 27,000 8,000 33,000 18,000 14,000 50,000 38,000 $126,000 $108,000 P17-7A The following are the financial statements of Nosker Company. NOSKER COMPANY Comparative Balance Sheets December 31 Assets Cash Accounts receivable Inventory Equipment Accumulated depreciation-equipment Total Liabilities and Stockholders' Equity Accounts payable Income taxes payable Bonds payable Common stock Retained earnings Total 2017 $ 38,000 2016 $ 20,000 30,000 14,000 27,000 20,000 60,000 78,000 (29,000) (24,000) $126,000 $108,000 $ 24,000 $ 15,000 7,000 27,000 8,000 33,000 18,000 14,000 50,000 38,000 $126,000 $108,000 1 NOSKER COMPANY Income Statement For the Year Ended December 31, 2017 Sales revenue $242,000 Cost of goods sold 175,000 Gross profit 67,000 Operating expenses 24,000 Income from operations 43,000 Interest expense 3,000 Income before income taxes 40,000 Income tax expense Net income 8,000 $ 32,000 Additional data: 1. Dividends declared and paid were $20,000. 2. During the year equipment was sold for $8,500 cash. This equipment cost $18,000 originally and had a book value of $8,500 at the time of sale. 3. All depreciation expense, $14,500, is in the operating expenses. 4. All sales and purchases are on account. Instructions (a) Prepare a statement of cash flows using the indirect method. (b) Compute free cash flow.
Step by Step Solution
There are 3 Steps involved in it
Step: 1
To prepare the statement of cash flows using the indirect method and compute the free cash flow follow these steps a Statement of Cash Flows Indirect ...
Get Instant Access to Expert-Tailored Solutions
See step-by-step solutions with expert insights and AI powered tools for academic success
Step: 2

Step: 3
Ace Your Homework with AI
Get the answers you need in no time with our AI-driven, step-by-step assistance
Get Started
ISO 9001 Audit Trail A Practical Guide To Process Auditing Following An Audit Trail
Authors: David John Seear
1st Edition
1477234896, 978-1477234891