// p1.c #include #include #include void bubble(int, char*[]); main() { int asize = 10; int i; int acount; char *array[asize]; char string[] = this is


// p1.c
#include
#include
#include
void bubble(int, char*[]);
main()
{
int asize = 10;
int i;
int acount;
char *array[asize];
char string[] = "this is the ten token sentence that should be sorted";
char *tokenptr;
tokenptr = strtok(string," ");
acount = 0;
while (tokenptr != NULL)
{array[acount] = tokenptr;
tokenptr = strtok(NULL," ");
acount++; }
for (i=1; i
printf("%s ", array[i]);
bubble(asize,array);
printf(" sorted list ");
for (i=1; i
printf("%10s length is %d ", array[i], strlen(array[i]));
}
void bubble(int size, char *arr[])
{
void swap(char *[], int, int);
int j, count;
for(j=1; j {for (count = 0;count
if(strcmp(arr[count],arr[count+1])>0)
swap(arr,count,count+1);
}
}
void swap(char *ptr1[], int first, int second)
{
char *temp;
temp = ptr1[first];
ptr1[first] = ptr1[second];
ptr1[second] = temp;
}
// p1.output.correct
this
is
the
ten
token
sentence
that
should
be
sorted
sorted list
be length is 2
is length is 2
sentence length is 8
should length is 6
sorted length is 6
ten length is 3
that length is 4
the length is 3
this length is 4
token length is 5
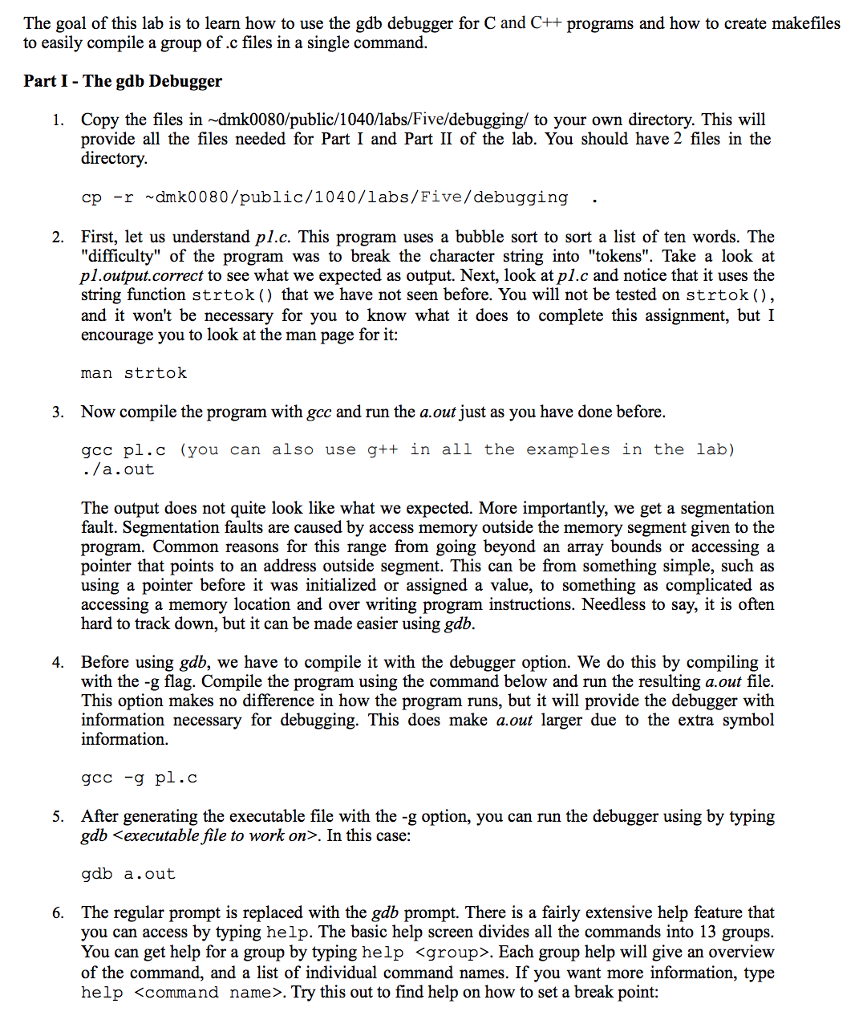
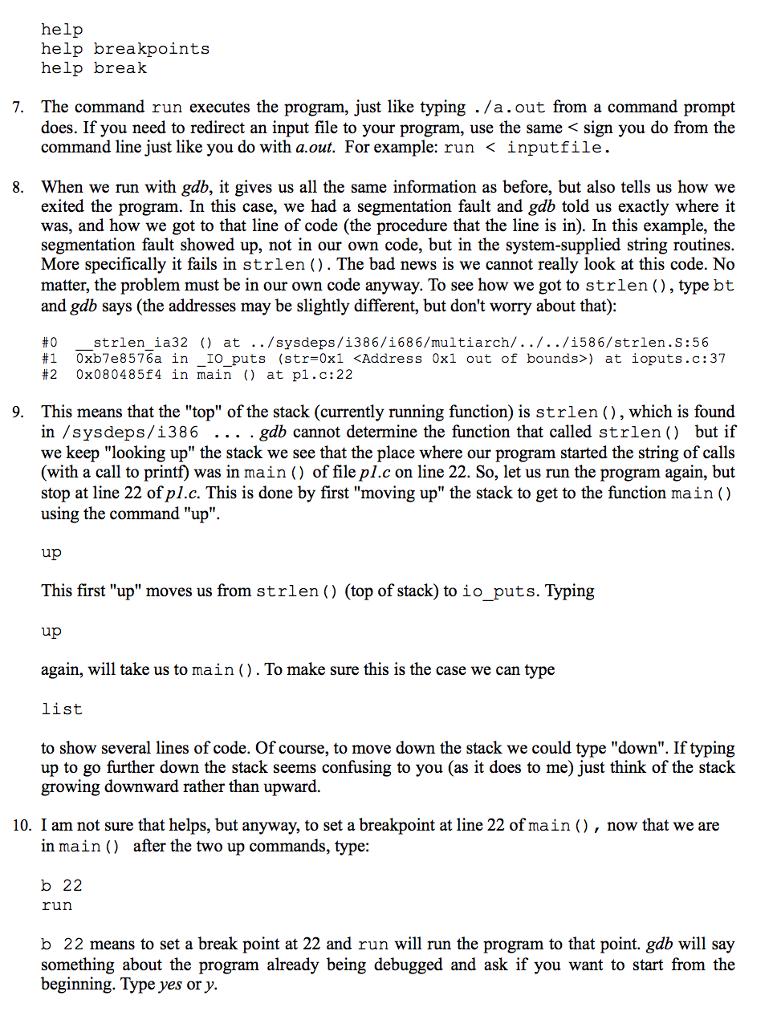
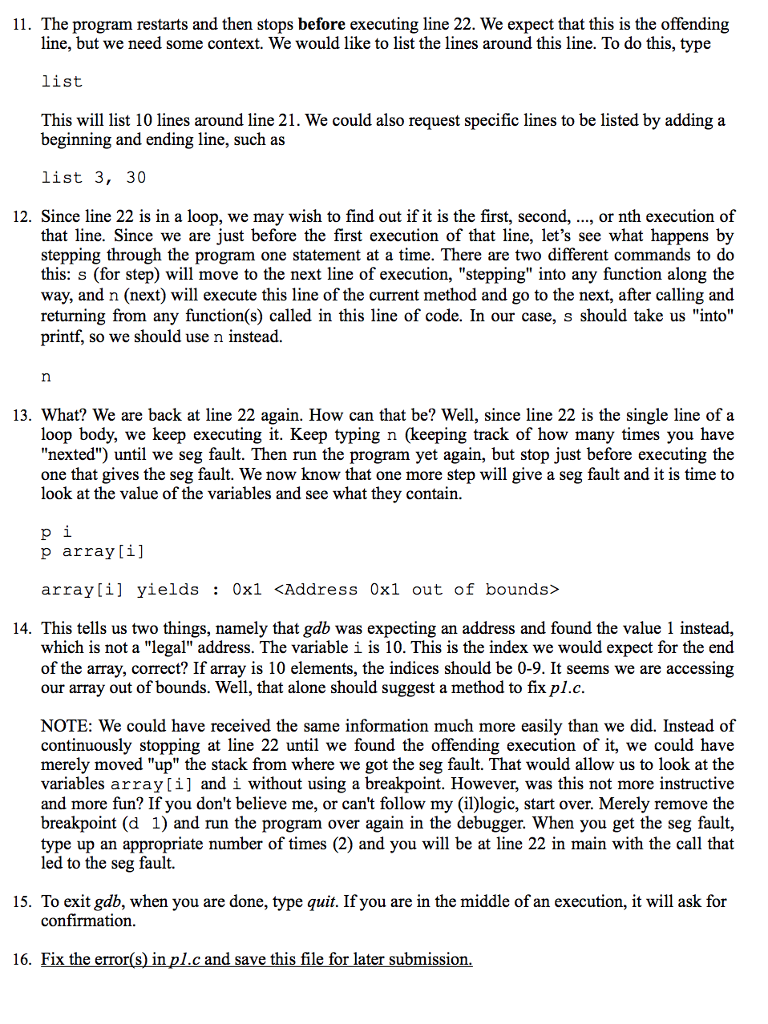
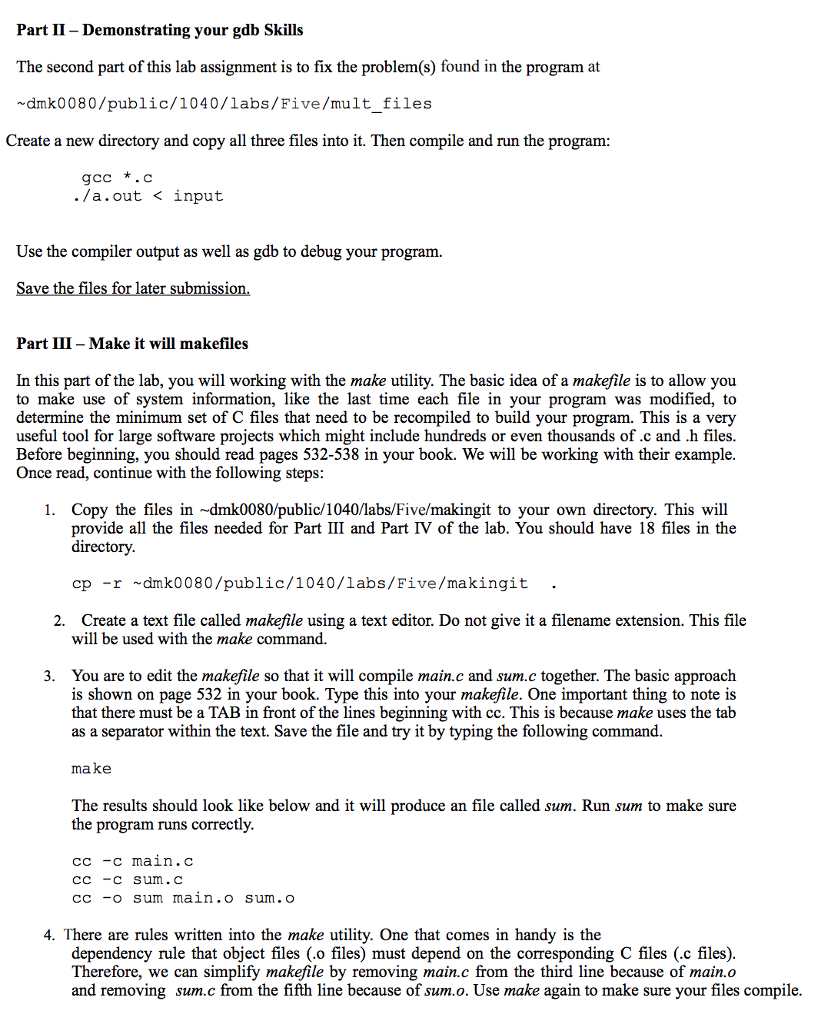
The goal of this lab is to learn how to use the gdb debugger for C and C++ programs and how to create makefiles to easily compile a group of .c files in a single command. Part I - The gdb Debugger 1. Copy the files in -dmk0080/public/1040/labs/Five/debugging/ to your own directory. This will provide all the files needed for Part I and Part II of the lab. You should have 2 files in the directory cp -r dmk0080/public/1040/labs/Five/debugging 2. First, let us understand pl.c. This program uses a bubble sort to sort a list of ten words. The "difficulty" of the program was to break the character string into "tokens". Take a look at pl.output.correct to see what we expected as output. Next, look at p/.c and notice that it uses the string function strtok () that we have not seen before. You will not be tested on strtok (), and it won't be necessary for you to know what it does to complete this assignment, butI encourage you to look at the man page for it: man strtok 3. Now compile the program with gcc and run the a.out just as you have done before gcc pl.c (you can also use g++ in all the examples in the lab) ./a.out The output does not quite look like what we expected. More importantly, we get a segmentation fault. Segmentation faults are caused by access memory outside the memory segment given to the program. Common reasons for this range from going beyond an array bounds or accessing a pointer that points to an address outside segment. This can be from something simple, such as using a pointer before it was initialized or assigned a value, to something as complicated as accessing a memory location and over writing program instructions. Needless to say, it is often hard to track down, but it can be made easier using gdb 4. Before using gdb, we have to compile it with the debugger option. We do this by compiling it with the -g flag. Compile the program using the command below and run the resulting a.out file This option makes no difference in how the program runs, but it will provide the debugger with information necessary for debugging. This does make a.out larger due to the extra symbol information. gcc-g pl.c After generating the executable file with the -g option, you can run the debugger using by typing gdb . In this case 5. gdb a.out The regular prompt is replaced with the gdb prompt. There is a fairly extensive help feature that you can access by typing help. The basic help screen divides all the commands into 13 groups You can get help for a group by typing help . Each group help will give an overview of the command, and a list of individual command names. If you want more information, type help . Try this out to find help on how to set a break point: 6. The goal of this lab is to learn how to use the gdb debugger for C and C++ programs and how to create makefiles to easily compile a group of .c files in a single command. Part I - The gdb Debugger 1. Copy the files in -dmk0080/public/1040/labs/Five/debugging/ to your own directory. This will provide all the files needed for Part I and Part II of the lab. You should have 2 files in the directory cp -r dmk0080/public/1040/labs/Five/debugging 2. First, let us understand pl.c. This program uses a bubble sort to sort a list of ten words. The "difficulty" of the program was to break the character string into "tokens". Take a look at pl.output.correct to see what we expected as output. Next, look at p/.c and notice that it uses the string function strtok () that we have not seen before. You will not be tested on strtok (), and it won't be necessary for you to know what it does to complete this assignment, butI encourage you to look at the man page for it: man strtok 3. Now compile the program with gcc and run the a.out just as you have done before gcc pl.c (you can also use g++ in all the examples in the lab) ./a.out The output does not quite look like what we expected. More importantly, we get a segmentation fault. Segmentation faults are caused by access memory outside the memory segment given to the program. Common reasons for this range from going beyond an array bounds or accessing a pointer that points to an address outside segment. This can be from something simple, such as using a pointer before it was initialized or assigned a value, to something as complicated as accessing a memory location and over writing program instructions. Needless to say, it is often hard to track down, but it can be made easier using gdb 4. Before using gdb, we have to compile it with the debugger option. We do this by compiling it with the -g flag. Compile the program using the command below and run the resulting a.out file This option makes no difference in how the program runs, but it will provide the debugger with information necessary for debugging. This does make a.out larger due to the extra symbol information. gcc-g pl.c After generating the executable file with the -g option, you can run the debugger using by typing gdb . In this case 5. gdb a.out The regular prompt is replaced with the gdb prompt. There is a fairly extensive help feature that you can access by typing help. The basic help screen divides all the commands into 13 groups You can get help for a group by typing help . Each group help will give an overview of the command, and a list of individual command names. If you want more information, type help . Try this out to find help on how to set a break point: 6
