

Answered step by step
Verified Expert Solution
Question
1 Approved Answer
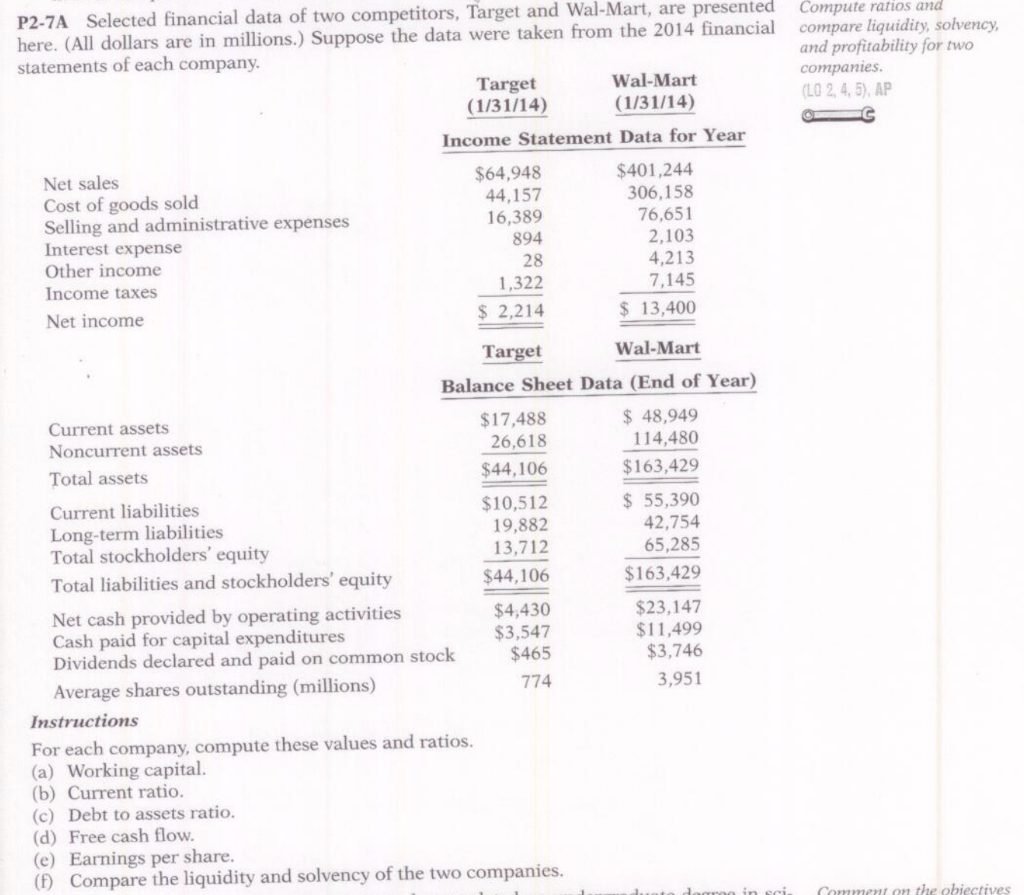
P2-7A Selected financial data of two competitors, Target and Wal-Mart, are presented here. (All dollars are in millions.) Suppose the data were taken from the
Step by Step Solution
There are 3 Steps involved in it
Step: 1

Get Instant Access to Expert-Tailored Solutions
See step-by-step solutions with expert insights and AI powered tools for academic success
Step: 2

Step: 3
Ace Your Homework with AI
Get the answers you need in no time with our AI-driven, step-by-step assistance
Get Started
Essentials Of Crm
Authors: Bryan Bergeron
1st Edition
0471206032, 978-0471206033