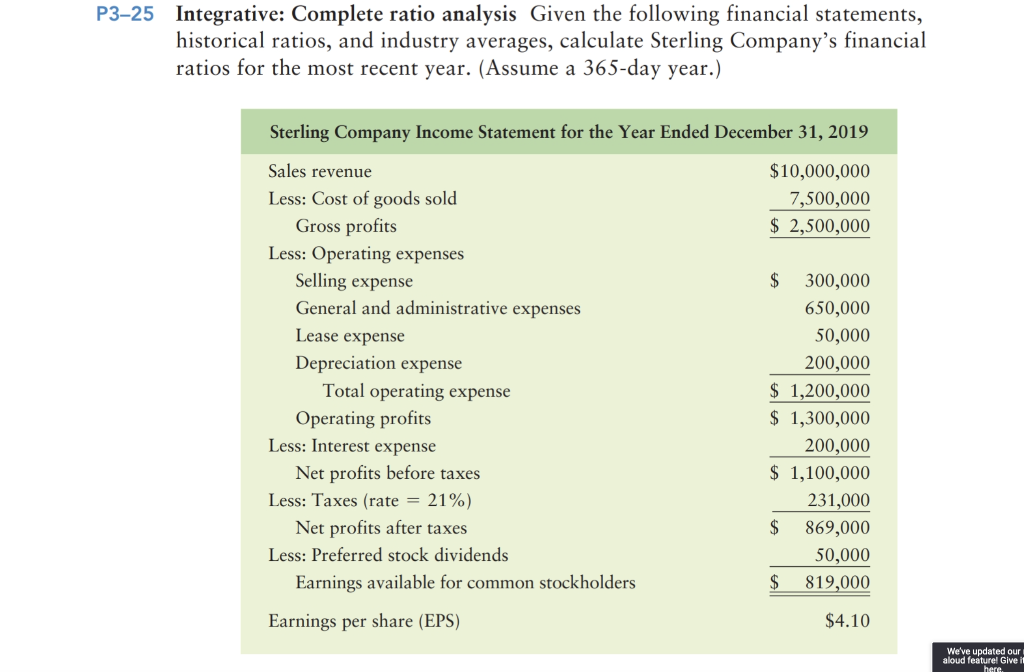
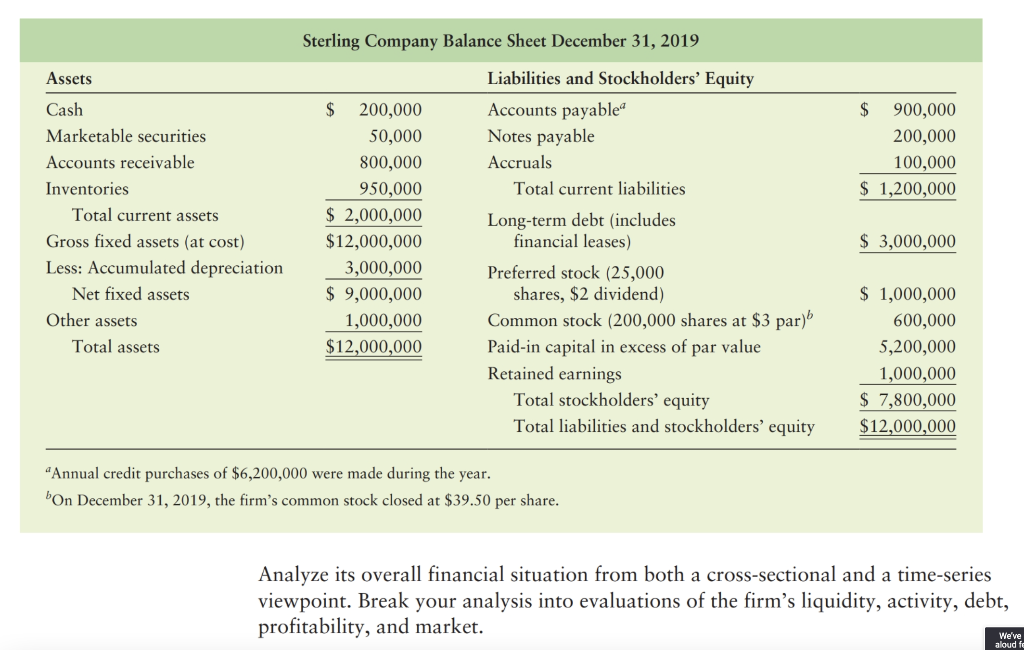
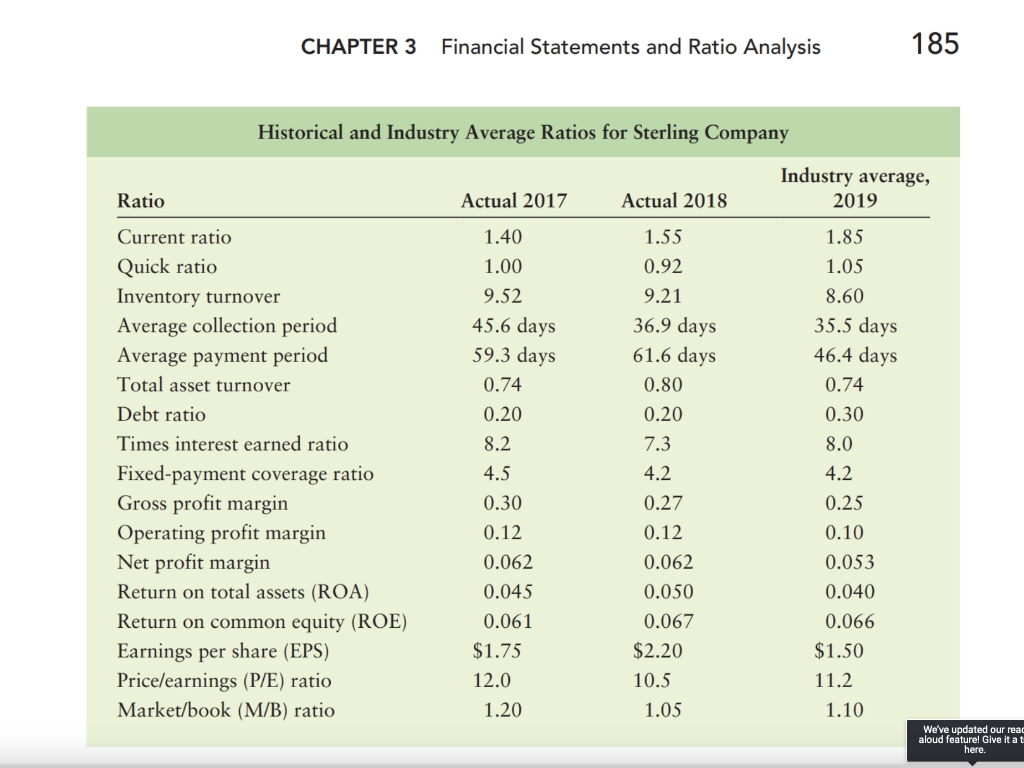
P3-25 Integrative: Complete ratio analysis Given the following financial statements, historical ratios, and industry averages, calculate Sterling Company's financial ratios for the most recent year. (Assume a 365-day year.) Sterling Company Income Statement for the Year Ended December 31, 2019 Sales revenue $10,000,000 7,500,000 $ 2,500,000 Less: Cost of goods sold Gross profits Less: Operating expenses Selling expense General and administrative expenses Lease expense Depreciation expense Total operating expense Operating profits Less: Interest expense Net profits before taxes Less: Taxes (rate = 21%) Net profits after taxes Less: Preferred stock dividends $ 300,000 650,000 50,000 200,000 $ 1,200,000 $ 1,300,000 200,000 $ 1,100,000 231,000 $ 869,000 50,000 $ 819,000 Earnings available for common stockholders Earnings per share (EPS) $4.10 We've updated our aloud featurel Give here Sterling Company Balance Sheet December 31, 2019 Assets Liabilities and Stockholders' Equity Cash $ 200,000 50,000 Marketable securities Accounts payable" Notes payable Accruals $ 900,000 200,000 100,000 $ 1,200,000 Accounts receivable 800,000 Inventories 950,000 Total current liabilities Total current assets Long-term debt (includes financial leases) $ 3,000,000 Gross fixed assets (at cost) Less: Accumulated depreciation Net fixed assets $ 2,000,000 $12,000,000 3,000,000 $ 9,000,000 1,000,000 $12,000,000 $ 1,000,000 600,000 Other assets Total assets Preferred stock (25,000 shares, $2 dividend) Common stock (200,000 shares at $3 par) Paid-in capital in excess of par value Retained earnings Total stockholders' equity Total liabilities and stockholders' equity 5,200,000 1,000,000 $ 7,800,000 $12,000,000 "Annual credit purchases of $6,200,000 were made during the year. bon December 31, 2019, the firm's common stock closed at $39.50 per share. Analyze its overall financial situation from both a cross-sectional and a time-series viewpoint. Break your analysis into evaluations of the firm's liquidity, activity, debt, profitability, and market. aloud We've CHAPTER 3 Financial Statements and Ratio Analysis 185 Historical and Industry Average Ratios for Sterling Company Industry average, 2019 Ratio Actual 2017 Actual 2018 Current ratio 1.40 1.55 1.85 1.00 0.92 1.05 9.52 9.21 8.60 Quick ratio Inventory turnover Average collection period Average payment period 45.6 days 59.3 days 0.74 36.9 days 61.6 days 35.5 days 46.4 days Total asset turnover 0.80 0.74 Debt ratio 0.20 0.20 0.30 Times interest earned ratio 8.2 7.3 8.0 4.5 4.2 4.2 0.30 0.27 0.25 0.12 0.12 0.10 0.062 0.062 0.053 Fixed-payment coverage ratio Gross profit margin Operating profit margin Net profit margin Return on total assets (ROA) Return on common equity (ROE) Earnings per share (EPS) Price/earnings (P/E) ratio Market/book (M/B) ratio 0.045 0.050 0.040 0.061 0.067 0.066 $1.75 $2.20 $1.50 12.0 10.5 11.2 1.20 1.05 1.10 We've updated our read aloud feature! Give it at here