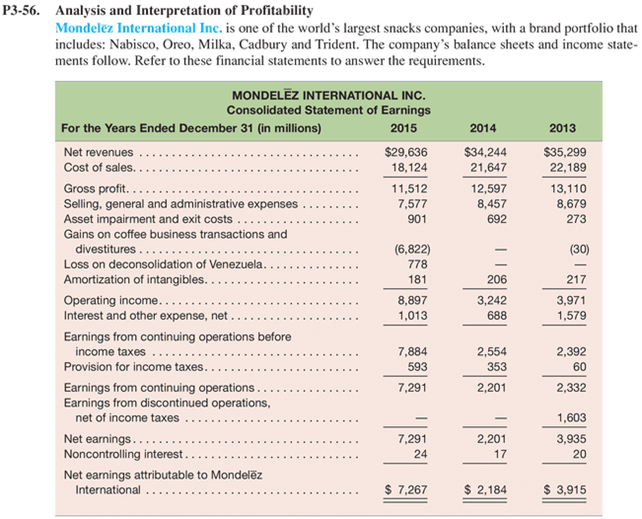
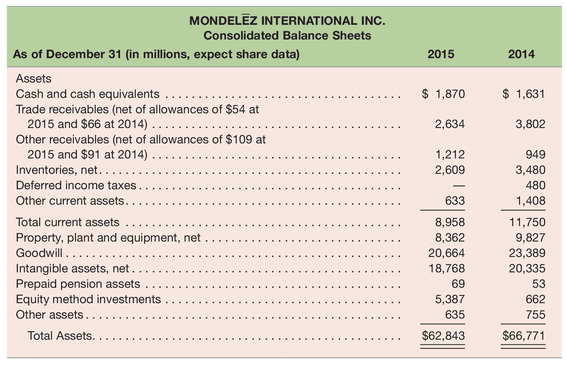
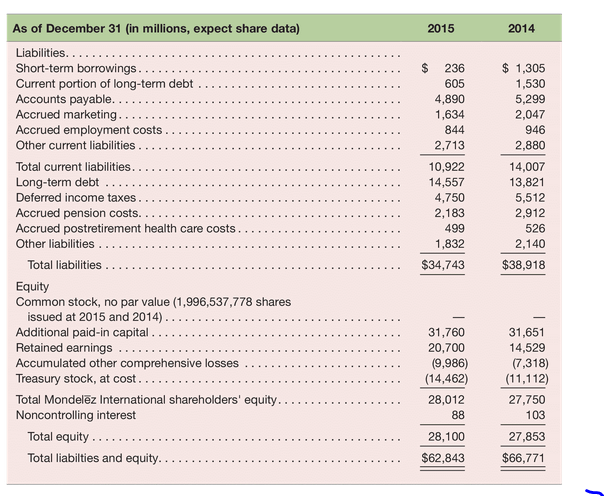
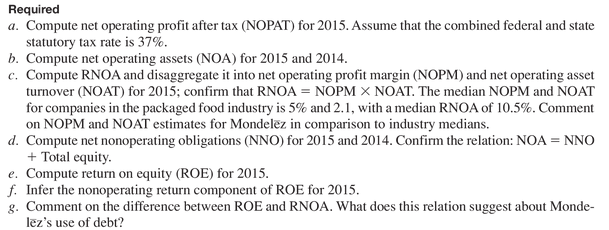
P3-56. Analysis and Interpretation of Profitability Mondelez International Inc. is one of the world's largest snacks companies, with a brand portfolio that includes: Nabisco, Oreo, Milka, Cadbury and Trident. The company's balance sheets and income state- ments follow. Refer to these financial statements to answer the requirements. 2014 $34,244 21,647 12,597 8,457 692 2013 $35,299 22,189 13,110 8,679 273 (30) 206 217 MONDELEZ INTERNATIONAL INC. Consolidated Statement of Earnings For the Years Ended December 31 (in millions) 2015 Net revenues $29,636 Cost of sales. 18,124 Gross profit. 11,512 Selling, general and administrative expenses 7,577 Asset impairment and exit costs. 901 Gains on coffee business transactions and divestitures.. (6,822) Loss on deconsolidation of Venezuela. 778 Amortization of intangibles.. 181 Operating income..... 8,897 Interest and other expense, net. 1,013 Earnings from continuing operations before income taxes 7,884 Provision for income taxes. 593 Earnings from continuing operations.. 7,291 Earnings from discontinued operations, net of income taxes Net earnings... 7,291 Noncontrolling interest. Net earnings attributable to Mondelz International $ 7,267 3,242 688 3,971 1,579 2,554 353 2,392 60 2,201 2,332 2,201 17 1,603 3,935 20 24 $ 7,287 $ 2,184 $ 3,915 2015 2014 $ 1,870 $ 1,631 2,634 3,802 MONDELEZ INTERNATIONAL INC. Consolidated Balance Sheets As of December 31 (in millions, expect share data) Assets Cash and cash equivalents Trade receivables (net of allowances of $54 at 2015 and $66 at 2014). Other receivables (net of allowances of $109 at 2015 and $91 at 2014). Inventories, net.. Deferred income taxes. Other current assets. Total current assets Property, plant and equipment, net Goodwill..... Intangible assets, net. Prepaid pension assets Equity method investments Other assets .... 1,212 2,609 949 3,480 480 1,408 633 8,958 8,362 20,664 18,768 69 5,387 635 11,750 9,827 23,389 20,335 53 662 755 - Total Assets. $62,843 $66,771 2015 2014 As of December 31 (in millions, expect share data) Liabilities.... Short-term borrowings. Current portion of long-term debt Accounts payable. Accrued marketing.. Accrued employment costs Other current liabilities. Total current liabilities.. Long-term debt Deferred income taxes. Accrued pension costs. Accrued postretirement health care costs Other liabilities Total liabilities Equity Common stock, no par value (1,996,537,778 shares issued at 2015 and 2014). Additional paid-in capital. Retained earnings ... Accumulated other comprehensive losses Treasury stock, at cost....... Total Mondelz International shareholders' equity.. Noncontrolling interest Total equity... Total liabilties and equity.. $ 236 605 4,890 1,634 844 2,713 10,922 14,557 4,750 2,183 499 1,832 $34,743 $ 1,305 1,530 5,299 2,047 946 2,880 14,007 13,821 5,512 2,912 526 2,140 $38,918 31,760 20,700 (9,986) (14,462) 28,012 88 31,651 14,529 (7,318) (11,112) 27,750 103 27,853 28,100 $62,843 $66,771 Required a. Compute net operating profit after tax (NOPAT) for 2015. Assume that the combined federal and state statutory tax rate is 37%. b. Compute net operating assets (NOA) for 2015 and 2014. c. Compute RNOA and disaggregate it into net operating profit margin (NOPM) and net operating asset turnover (NOAT) for 2015; confirm that RNOA = NOPM X NOAT. The median NOPM and NOAT for companies in the packaged food industry is 5% and 2.1, with a median RNOA of 10.5%. Comment on NOPM and NOAT estimates for Mondelez in comparison to industry medians. d. Compute net nonoperating obligations (NNO) for 2015 and 2014. Confirm the relation: NOA = NNO + Total equity. e. Compute return on equity (ROE) for 2015. f. Infer the nonoperating return component of ROE for 2015. g. Comment on the difference between ROE and RNOA. What does this relation suggest about Monde- lez's use of debt? P3-56. Analysis and Interpretation of Profitability Mondelez International Inc. is one of the world's largest snacks companies, with a brand portfolio that includes: Nabisco, Oreo, Milka, Cadbury and Trident. The company's balance sheets and income state- ments follow. Refer to these financial statements to answer the requirements. 2014 $34,244 21,647 12,597 8,457 692 2013 $35,299 22,189 13,110 8,679 273 (30) 206 217 MONDELEZ INTERNATIONAL INC. Consolidated Statement of Earnings For the Years Ended December 31 (in millions) 2015 Net revenues $29,636 Cost of sales. 18,124 Gross profit. 11,512 Selling, general and administrative expenses 7,577 Asset impairment and exit costs. 901 Gains on coffee business transactions and divestitures.. (6,822) Loss on deconsolidation of Venezuela. 778 Amortization of intangibles.. 181 Operating income..... 8,897 Interest and other expense, net. 1,013 Earnings from continuing operations before income taxes 7,884 Provision for income taxes. 593 Earnings from continuing operations.. 7,291 Earnings from discontinued operations, net of income taxes Net earnings... 7,291 Noncontrolling interest. Net earnings attributable to Mondelz International $ 7,267 3,242 688 3,971 1,579 2,554 353 2,392 60 2,201 2,332 2,201 17 1,603 3,935 20 24 $ 7,287 $ 2,184 $ 3,915 2015 2014 $ 1,870 $ 1,631 2,634 3,802 MONDELEZ INTERNATIONAL INC. Consolidated Balance Sheets As of December 31 (in millions, expect share data) Assets Cash and cash equivalents Trade receivables (net of allowances of $54 at 2015 and $66 at 2014). Other receivables (net of allowances of $109 at 2015 and $91 at 2014). Inventories, net.. Deferred income taxes. Other current assets. Total current assets Property, plant and equipment, net Goodwill..... Intangible assets, net. Prepaid pension assets Equity method investments Other assets .... 1,212 2,609 949 3,480 480 1,408 633 8,958 8,362 20,664 18,768 69 5,387 635 11,750 9,827 23,389 20,335 53 662 755 - Total Assets. $62,843 $66,771 2015 2014 As of December 31 (in millions, expect share data) Liabilities.... Short-term borrowings. Current portion of long-term debt Accounts payable. Accrued marketing.. Accrued employment costs Other current liabilities. Total current liabilities.. Long-term debt Deferred income taxes. Accrued pension costs. Accrued postretirement health care costs Other liabilities Total liabilities Equity Common stock, no par value (1,996,537,778 shares issued at 2015 and 2014). Additional paid-in capital. Retained earnings ... Accumulated other comprehensive losses Treasury stock, at cost....... Total Mondelz International shareholders' equity.. Noncontrolling interest Total equity... Total liabilties and equity.. $ 236 605 4,890 1,634 844 2,713 10,922 14,557 4,750 2,183 499 1,832 $34,743 $ 1,305 1,530 5,299 2,047 946 2,880 14,007 13,821 5,512 2,912 526 2,140 $38,918 31,760 20,700 (9,986) (14,462) 28,012 88 31,651 14,529 (7,318) (11,112) 27,750 103 27,853 28,100 $62,843 $66,771 Required a. Compute net operating profit after tax (NOPAT) for 2015. Assume that the combined federal and state statutory tax rate is 37%. b. Compute net operating assets (NOA) for 2015 and 2014. c. Compute RNOA and disaggregate it into net operating profit margin (NOPM) and net operating asset turnover (NOAT) for 2015; confirm that RNOA = NOPM X NOAT. The median NOPM and NOAT for companies in the packaged food industry is 5% and 2.1, with a median RNOA of 10.5%. Comment on NOPM and NOAT estimates for Mondelez in comparison to industry medians. d. Compute net nonoperating obligations (NNO) for 2015 and 2014. Confirm the relation: NOA = NNO + Total equity. e. Compute return on equity (ROE) for 2015. f. Infer the nonoperating return component of ROE for 2015. g. Comment on the difference between ROE and RNOA. What does this relation suggest about Monde- lez's use of debt