

Answered step by step
Verified Expert Solution
Question
1 Approved Answer
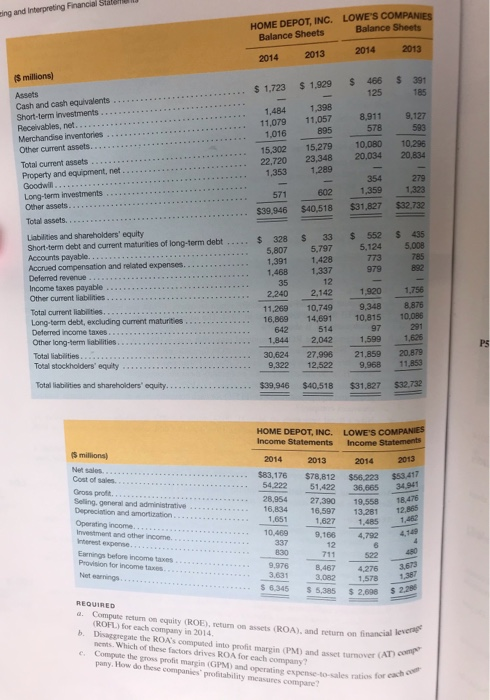
P5-38. Analysis and Interpretation of Return on Investment for Competitors Balance sheets and income statements for The Home Depot, Inc., and Lowe's Companies, Inc., follow.

Step by Step Solution
There are 3 Steps involved in it
Step: 1

Get Instant Access to Expert-Tailored Solutions
See step-by-step solutions with expert insights and AI powered tools for academic success
Step: 2

Step: 3
Ace Your Homework with AI
Get the answers you need in no time with our AI-driven, step-by-step assistance
Get Started
Crash Course Medical Research Audit And Teaching The Essentials For Career Success
Authors: Amit Kaura MSc BSc MB ChB MRCP AFHEA AMInstLM, Darrel Francis, Shreelata T Datta MD MRCOG LLM MBBS BSc, Philip Xiu MA MB BChir MRCP MRCGP MScClinEd FHEA MAcadMEd RCPathME
2nd Edition
0702073784, 978-0702073786