

Answered step by step
Verified Expert Solution
Question
1 Approved Answer
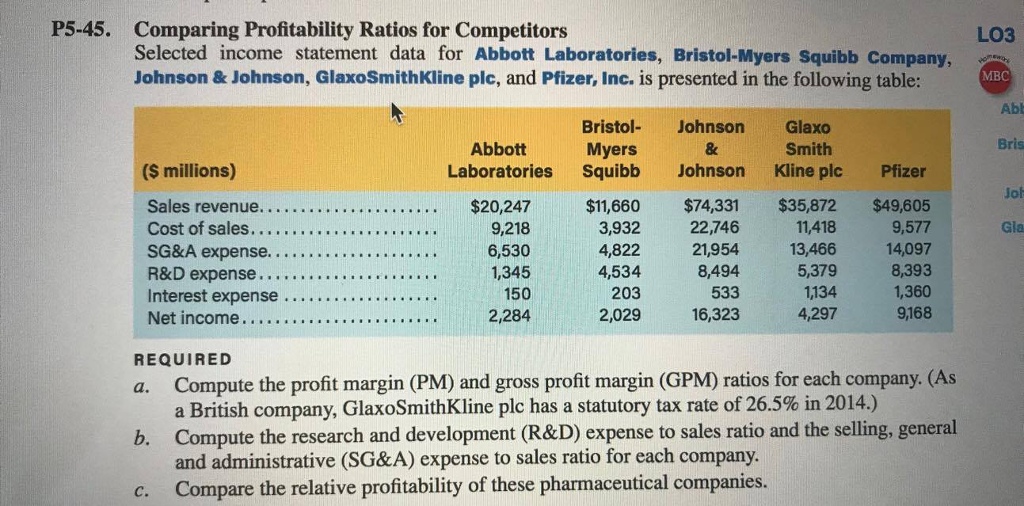
P5-45. Comparing Profitability Ratios for Competitors L03 Selected income statement data for Abbott Laboratories, BristolMyers Squibb Company, A Johnson & Johnson, GlaxoSmithKline plc, and Pfizer,
Step by Step Solution
There are 3 Steps involved in it
Step: 1

Get Instant Access to Expert-Tailored Solutions
See step-by-step solutions with expert insights and AI powered tools for academic success
Step: 2

Step: 3
Ace Your Homework with AI
Get the answers you need in no time with our AI-driven, step-by-step assistance
Get Started
Funds Private Equity Hedge And All Core Structures
Authors: Matthew Hudson
1st Edition
1118790405, 978-1118790403