Answered step by step
Verified Expert Solution
Link Copied!

Question

1 Approved Answer

P6-11B The following information is available for PepsiCo, Inc. (in U.S. $ millions): 2015 2014 2013 Cost of goods $28,384 $30,88 $31,24 sold 3 Inventories
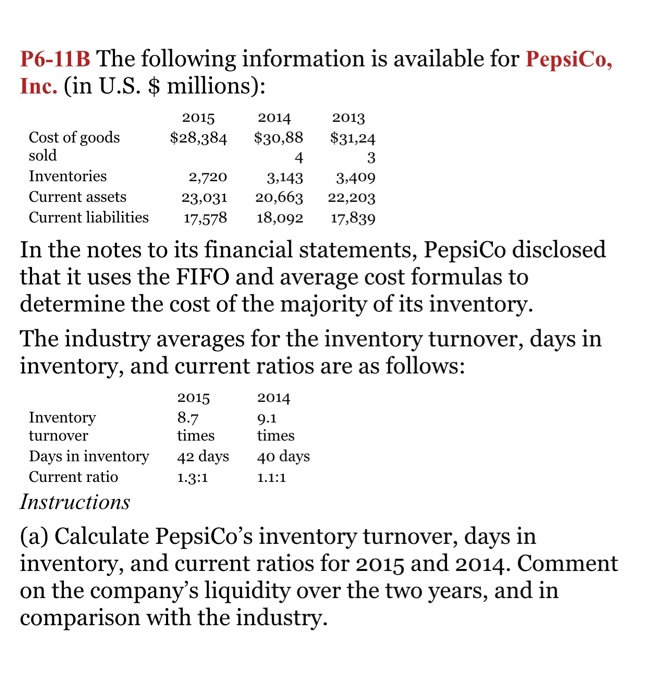
image text in transcribed
P6-11B The following information is available for PepsiCo, Inc. (in U.S. $ millions): 2015 2014 2013 Cost of goods $28,384 $30,88 $31,24 sold 3 Inventories 2,720 3,143 3,409 Current assets 23,031 20,663 22,203 Current liabilities 17,578 18,092 17,839 In the notes to its financial statements, PepsiCo disclosed that it uses the FIFO and average cost formulas to determine the cost of the majority of its inventory. The industry averages for the inventory turnover, days in inventory, and current ratios are as follows: 2015 2014 Inventory 8.7 9.1 turnover times times Days in inventory 42 days 40 days Current ratio 1.3:1 1.1:1 Instructions (a) Calculate PepsiCo's inventory turnover, days in inventory, and current ratios for 2015 and 2014. Comment on the company's liquidity over the two years, and in comparison with the industry

Step by Step Solution

There are 3 Steps involved in it

Step: 1

blur-text-image

Get Instant Access to Expert-Tailored Solutions

See step-by-step solutions with expert insights and AI powered tools for academic success

Step: 2

blur-text-image

Step: 3

blur-text-image

Ace Your Homework with AI

Get the answers you need in no time with our AI-driven, step-by-step assistance

Get Started

Recommended Textbook for

Life Audit Workbook Meant For More

Authors: Agnese Iskrova

1st Edition

1716274958, 978-1716274954

More Books

Students also viewed these Accounting questions

Question

40 Job pricing and pay structures.

Answered: 1 week ago

Question

Compose the six common types of social business messages.

Answered: 1 week ago

Question

Describe positive and neutral messages.

Answered: 1 week ago