

Answered step by step
Verified Expert Solution
Question
1 Approved Answer
P7-3 (Static) Evaluating Four Alternative Inventory Methods Based on Income and Cash Flow L07-2, 7-3 At the end of January of the current year, the
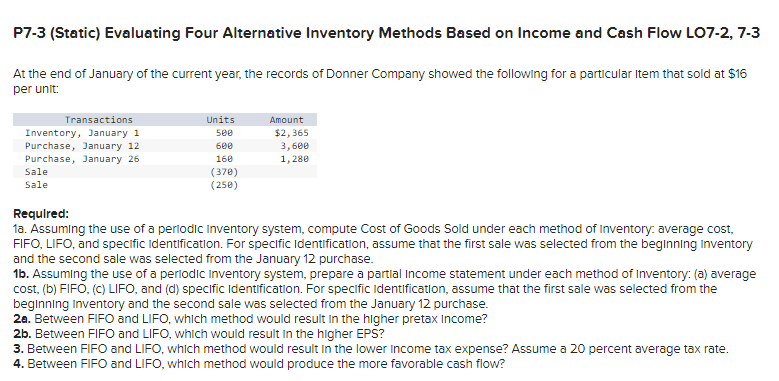
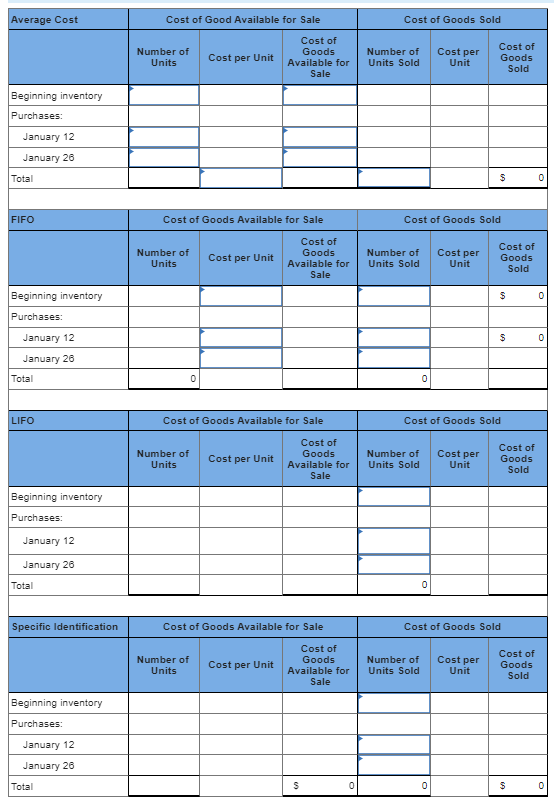
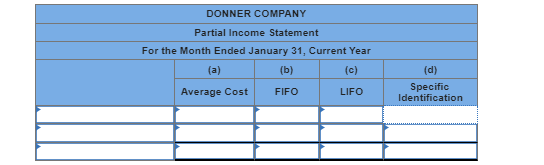 P7-3 (Static) Evaluating Four Alternative Inventory Methods Based on Income and Cash Flow L07-2, 7-3 At the end of January of the current year, the records of Donner Company showed the following for a particular Item that sold at $16 per unit: Required: 1a. Assuming the use of a perlodic Inventory system, compute Cost of Goods Sold under each method of Inventory. average cost, FIFO, LIFO, and specific Identlfication. For specific Identification, assume that the first sale was selected from the beginnling Inventory and the second sale was selected from the January 12 purchase. 1b. Assuming the use of a perlodic Inventory system, prepare a partlal Income statement under each method of Inventory: (a) average cost, (b) FIFO, (c) LIFO, and (d) specific Identification. For specific Identlfication, assume that the first sale was selected from the beginning Inventory and the second sale was selected from the January 12 purchase. 2a. Between FIFO and LIFO, which method would result in the higher pretax Income? 2b. Between FIFO and LIFO, which would result in the higher EPS? 3. Between FIFO and LIFO, which method would result In the lower Income tax expense? Assume a 20 percent average tax rate. 4. Between FIFO and LIFO, which method would produce the more favorable cash flow? \begin{tabular}{|c|c|c|c|c|c|c|} \hline \multirow[t]{2}{*}{ Average Cost } & \multicolumn{3}{|c|}{ Cost of Good Available for Sale } & \multicolumn{3}{|c|}{ Cost of Goods Sold } \\ \hline & \begin{tabular}{c} Number of \\ Units \end{tabular} & Cost per Unit & \begin{tabular}{c} Cost of \\ Goods \\ Available for \\ Sale \end{tabular} & \begin{tabular}{l} Number of \\ Units Sold \end{tabular} & \begin{tabular}{c} Cost per \\ Unit \end{tabular} & \begin{tabular}{l} Cost of \\ Goods \\ Sold \end{tabular} \\ \hline \multicolumn{7}{|l|}{ Beginning inventory } \\ \hline \multicolumn{7}{|l|}{ Purchases: } \\ \hline \multicolumn{7}{|l|}{ January 12} \\ \hline \multicolumn{7}{|l|}{ January 26} \\ \hline Total & & & & & & $ \\ \hline \multirow[t]{2}{*}{ FIFO } & \multicolumn{3}{|c|}{ Cost of Goods Available for Sale } & \multicolumn{3}{|c|}{ Cost of Goods Sold } \\ \hline & \begin{tabular}{c} Number of \\ Units \end{tabular} & Cost per Unit & \begin{tabular}{c} Cost of \\ Goods \\ Available for \\ Sale \end{tabular} & \begin{tabular}{l} Number of \\ Units Sold \end{tabular} & \begin{tabular}{c} Cost per \\ Unit \end{tabular} & \begin{tabular}{l} Cost of \\ Goods \\ Sold \end{tabular} \\ \hline Beginning inventory & & & & & & $ \\ \hline \multicolumn{7}{|l|}{ Purchases: } \\ \hline January 12 & & & & & & $ \\ \hline \multicolumn{7}{|l|}{ January 26} \\ \hline Total & 0 & & & 0 & & \\ \hline \multirow[t]{2}{*}{ LIFO } & \multicolumn{3}{|c|}{ Cost of Goods Available for Sale } & \multicolumn{3}{|c|}{ Cost of Goods Sold } \\ \hline & \begin{tabular}{c} Number of \\ Units \end{tabular} & Cost per Unit & \begin{tabular}{c} Cost of \\ Goods \\ Available for \\ Sale \end{tabular} & \begin{tabular}{l} Number of \\ Units Sold \end{tabular} & \begin{tabular}{c} Cost per \\ Unit \end{tabular} & \begin{tabular}{l} Cost of \\ Goods \\ Sold \end{tabular} \\ \hline \multicolumn{7}{|l|}{ Beginning inventory } \\ \hline \multicolumn{7}{|l|}{ Purchases: } \\ \hline \multicolumn{7}{|l|}{ January 12} \\ \hline \multicolumn{7}{|l|}{ January 26} \\ \hline Total & & & & 0 & & \\ \hline \multirow[t]{2}{*}{ Specific Identification } & \multicolumn{3}{|c|}{ Cost of Goods Available for Sale } & \multicolumn{3}{|c|}{ Cost of Goods Sold } \\ \hline & \begin{tabular}{c} Number of \\ Units \end{tabular} & Cost per Unit & \begin{tabular}{c} Cost of \\ Goods \\ Available for \\ Sale \end{tabular} & \begin{tabular}{l} Number of \\ Units Sold \end{tabular} & \begin{tabular}{c} Cost per \\ Unit \end{tabular} & \begin{tabular}{l} Cost of \\ Goods \\ Sold \end{tabular} \\ \hline \multicolumn{7}{|l|}{ Beginning inventory } \\ \hline \multicolumn{7}{|l|}{ Purchases: } \\ \hline \multicolumn{7}{|l|}{ January 12} \\ \hline \multicolumn{7}{|l|}{ January 26} \\ \hline Total & & & s & 0 & & $ \\ \hline \end{tabular}
 Step by Step Solution
There are 3 Steps involved in it
Step: 1

Get Instant Access to Expert-Tailored Solutions
See step-by-step solutions with expert insights and AI powered tools for academic success
Step: 2

Step: 3
Ace Your Homework with AI
Get the answers you need in no time with our AI-driven, step-by-step assistance
Get Started
Intermediate Accounting
Authors: Donald E. Kieso, Jerry J. Weygandt, Terry D. Warfield, Nicola M. Young, Irene M. Wiecek, Bruce J. McConomy
10th Canadian Edition Volume 2
1118300858, 978-1118300855