

Question
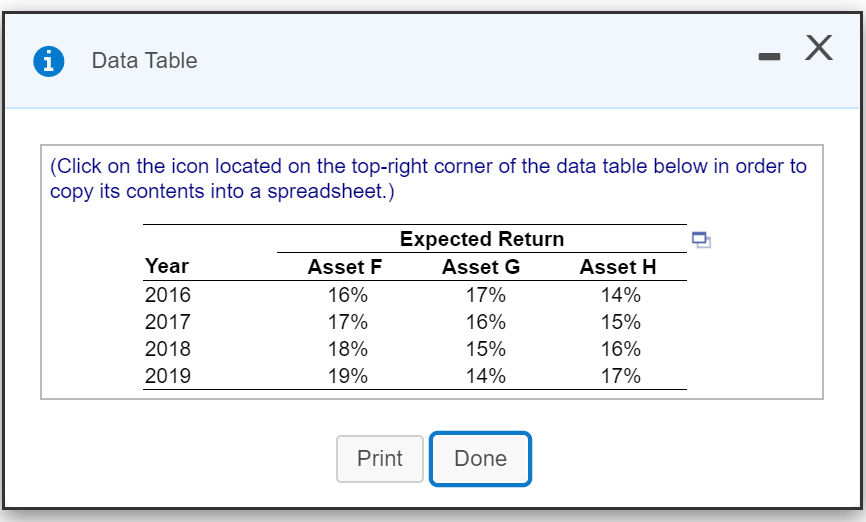
P8-14 Portfolio analysisYou have been given the expected return data shown in the first table on three Assets F, G, and H over the period
P8-14 Portfolio analysisYou have been given the expected return data shown in the first table on three Assets F, G, and H over the period 2016-2019:
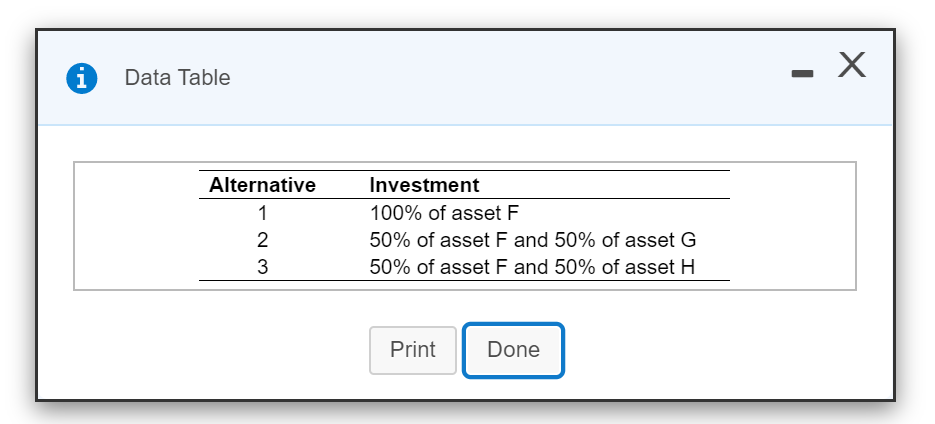
Using these assets, you have isolated the three investment alternatives shown in the following table:
a.Calculate the average return over the 4-year period for each of the three alternatives.
b.Calculate the standard deviation of returns over the 4-year period for each of the three alternatives.
c.Use your findings in parts a and b to calculate the coefficient of variation for each of the three alternatives.
d.On the basis of your findings, which of the three investment alternatives do you think performed better over this period? Why?
- X 1 Data Table (Click on the icon located on the top-right corner of the data table below in order to copy its contents into a spreadsheet.) Year 2016 2017 2018 2019 Asset F 16% 17% 18% 19% Expected Return Asset G 17% 16% 15% 14% Asset H 14% 15% 16% 17% Print Done - X i Data Table Alternative 1 Investment 100% of asset F 50% of asset F and 50% of asset G 50% of asset F and 50% of asset H 2 3 Print DoneStep by Step Solution
There are 3 Steps involved in it
Step: 1

Get Instant Access to Expert-Tailored Solutions
See step-by-step solutions with expert insights and AI powered tools for academic success
Step: 2

Step: 3
Ace Your Homework with AI
Get the answers you need in no time with our AI-driven, step-by-step assistance
Get Started
Value Investing
Authors: Mike Hartley
1st Edition
979-8864443309