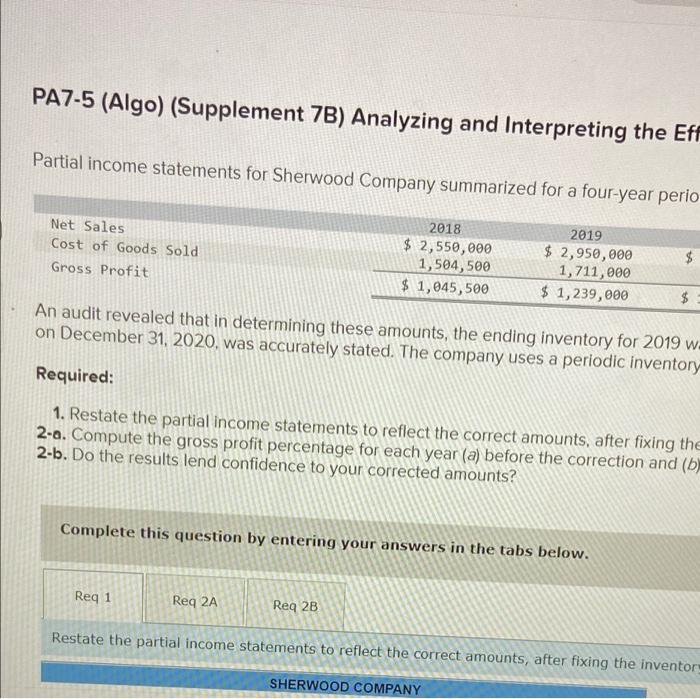
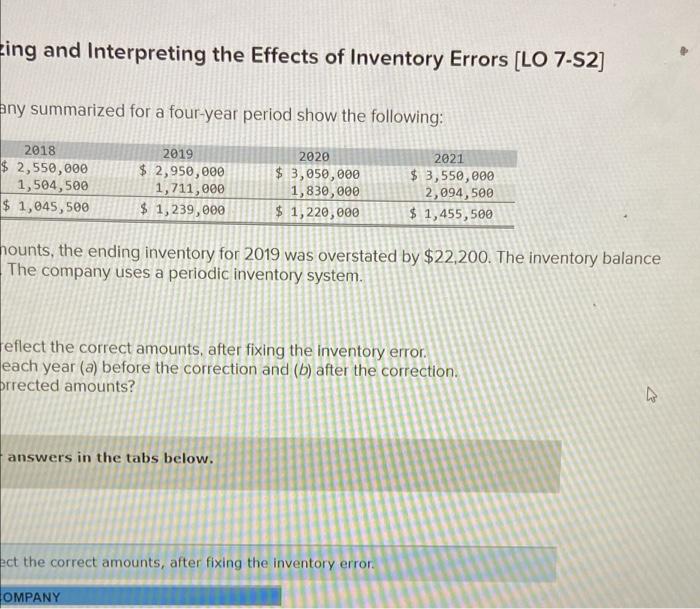
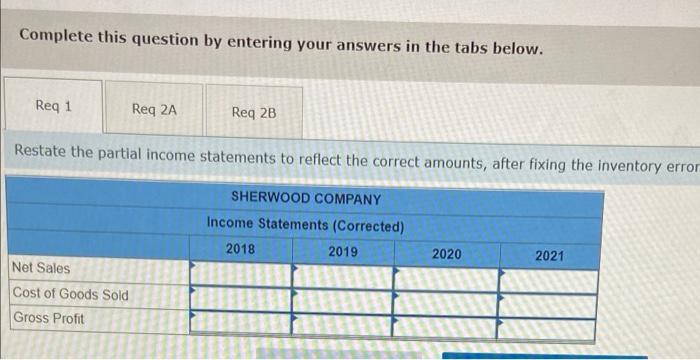
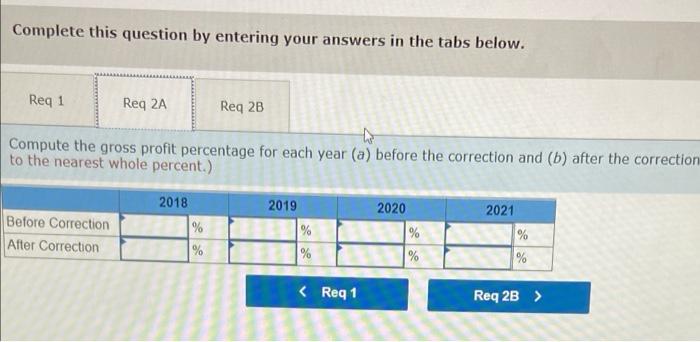
PA7-5 (Algo) (Supplement 7B) Analyzing and Interpreting the Eff Partial income statements for Sherwood Company summarized for a four-year perio Net Sales Cost of Goods Sold Gross Profit 2018 $ 2,550,000 1,504,500 $ 1,045,500 2019 $ 2,950,000 1,711,000 $ 1,239,000 $ An audit revealed that in determining these amounts, the ending inventory for 2019 w- on December 31, 2020, was accurately stated. The company uses a periodic inventory Required: 1. Restate the partial income statements to reflect the correct amounts, after fixing the 2-a. Compute the gross profit percentage for each year (a) before the correction and (b) 2-b. Do the results lend confidence to your corrected amounts? Complete this question by entering your answers in the tabs below. Req 1 Req 2A Req 2B Restate the partial income statements to reflect the correct amounts, after fixing the inventor SHERWOOD COMPANY zing and Interpreting the Effects of Inventory Errors [LO 7-S2) any summarized for a four-year period show the following: 2018 $ 2,550,000 1,504,500 $ 1,045,500 2019 $ 2,950,000 1,711,000 $ 1,239,000 2020 $ 3,050,000 1,830,000 $ 1,220,000 2021 $ 3,550,000 2,094,500 $ 1,455,500 nounts, the ending inventory for 2019 was overstated by $22,200. The inventory balance The company uses a periodic inventory system. Teflect the correct amounts, after fixing the inventory error. each year (a) before the correction and (b) after the correction. prrected amounts? answers in the tabs below. ect the correct amounts, after fixing the inventory error OMPANY Complete this question by entering your answers in the tabs below. Req 1 Req 2A Req 2B Restate the partial income statements to reflect the correct amounts, after fixing the inventory error SHERWOOD COMPANY Income Statements (Corrected) 2018 2019 2020 2021 Net Sales Cost of Goods Sold Gross Profit Complete this question by entering your answers in the tabs below. Req 1 Req 2A Req 2B Compute the gross profit percentage for each year (a) before the correction and (b) after the correction to the nearest whole percent.) 2021 Before Correction After Correction 2018 1% % 2019 % % 2020 % % %


