Answered step by step
Verified Expert Solution
Question
1 Approved Answer
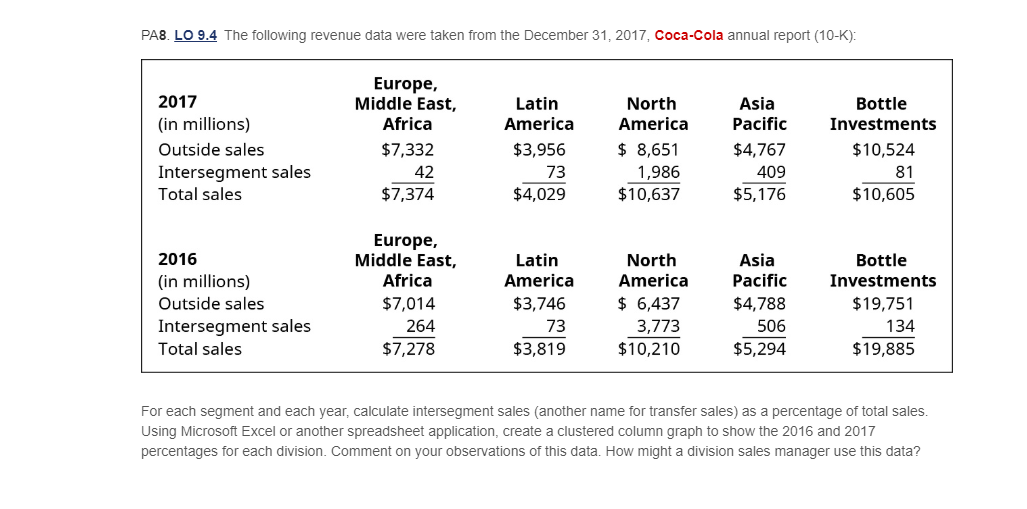
PA8. LO 9.4 The following revenue data were taken from the December 31, 2017, Coca-Cola annual report (10-K): 2017 (in millions) Outside sales Intersegment sales
Step by Step Solution
There are 3 Steps involved in it
Step: 1

Get Instant Access to Expert-Tailored Solutions
See step-by-step solutions with expert insights and AI powered tools for academic success
Step: 2

Step: 3
Ace Your Homework with AI
Get the answers you need in no time with our AI-driven, step-by-step assistance
Get Started