

Answered step by step
Verified Expert Solution
Question
1 Approved Answer
Page > of 3 MP 4: Lorenz Curve, Gini Index, Robin Hood Index Economists have long used mathematics to study the distribution of wealth
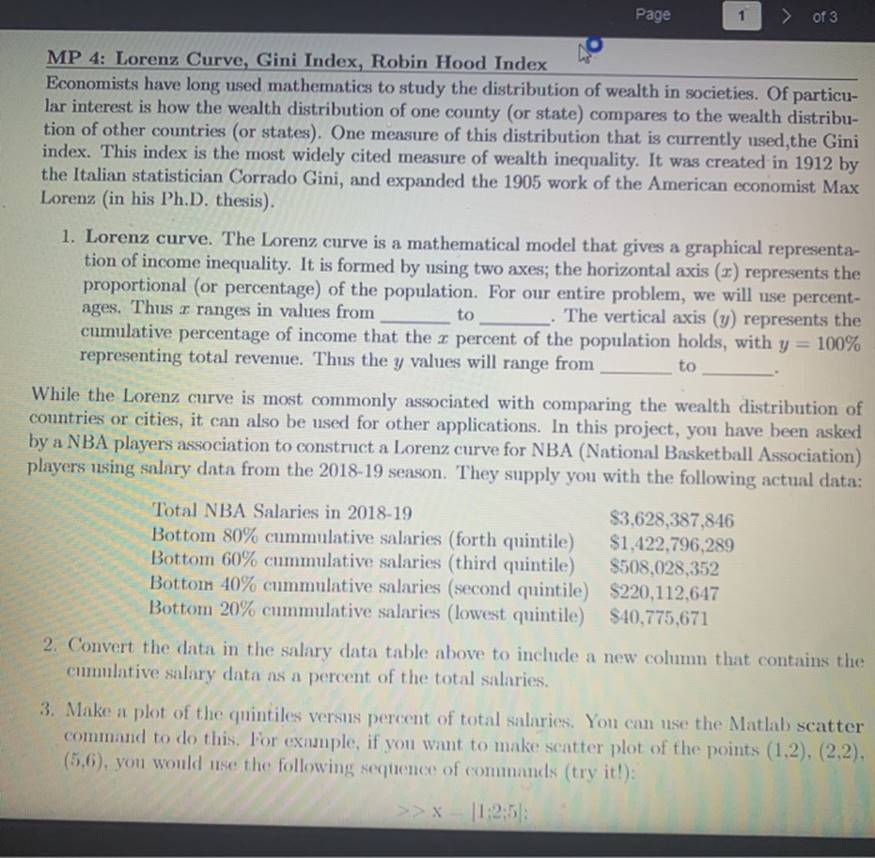
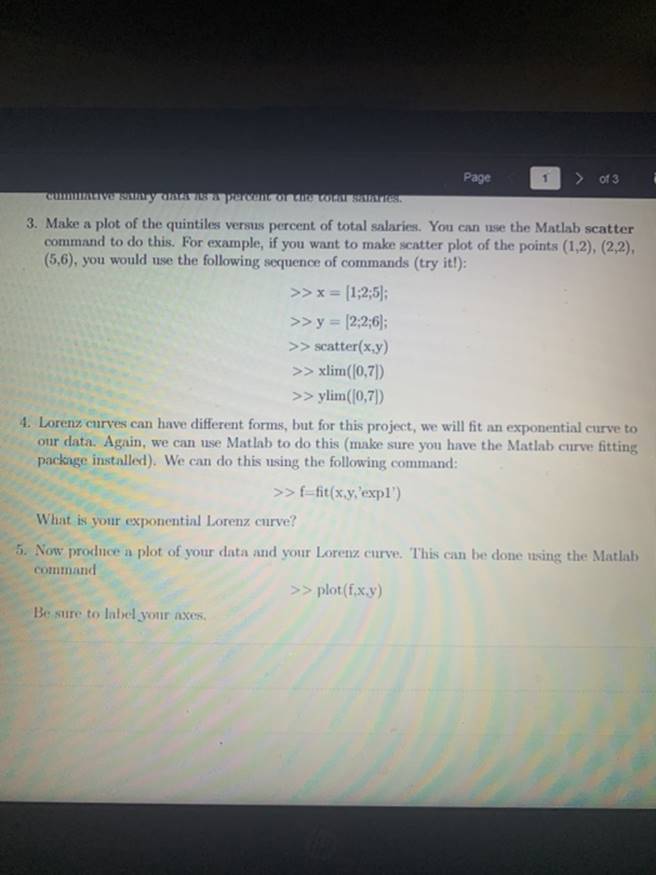
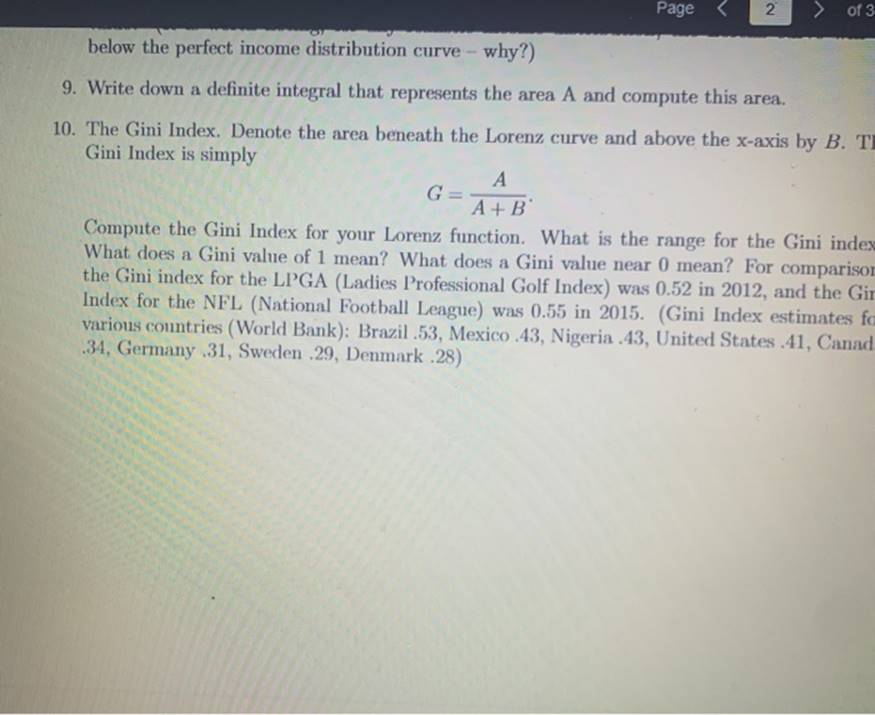
Page > of 3 MP 4: Lorenz Curve, Gini Index, Robin Hood Index Economists have long used mathematics to study the distribution of wealth in societies. Of particu- lar interest is how the wealth distribution of one county (or state) compares to the wealth distribu- tion of other countries (or states). One measure of this distribution that is currently used,the Gini index. This index is the most widely cited measure of wealth inequality. It was created in 1912 by the Italian statistician Corrado Gini, and expanded the 1905 work of the American economist Max Lorenz (in his Ph.D. thesis). 1. Lorenz curve. The Lorenz curve is a mathematical model that gives a graphical representa- tion of income inequality. It is formed by using two axes; the horizontal axis (r) represents the proportional (or percentage) of the population. For our entire problem, we will use percent- ages. Thus r ranges in values from cumulative percentage of income that the I percent of the population holds, with y = 100% representing total revenue. Thus the y values will range from to . The vertical axis (y) represents the to While the Lorenz curve is most commonly associated with comparing the wealth distribution of countries or cities, it can also be used for other applications. In this project, you have been asked by a NBA players association to construct a Lorenz curve for NBA (National Basketball Association) players using salary data from the 2018-19 season. They supply you with the following actual data: Total NBA Salaries in 2018-19 Bottom 80% cummulative salaries (forth quintile) Bottom 60% cummulative salaries (third quintile) Bottom 40% cummulative salaries (second quintile) $220,112,647 Bottom 20% cmmulative salaries (lowest quintile) $40,775,671 $3,628,387,846 $1,422,796,289 $508,028,352 2. Convert the data in the salary data table above to include a new column that contains the cumulative salary data as a percent of the total salaries. 3. Make a plot of the quintiles versus percent of total salaries. You can use the Matlab scatter command to do this. For example, if you want to make scatter plot of the points (1,2), (2,2), (5,6), you would use the following sequence of commands (try it!): |1:2:5: Page > of 3 cumativer ary daS8 a percen or the COrar salarrtes 3. Make a plot of the quintiles versus percent of total salaries. You can use the Matlab scatter command to do this. For example, if you want to make scatter plot of the points (1,2), (2,2), (5,6), you would use the following sequence of commands (try it!): >> x = [1;2;5); >> y = [2:2,6); >> scatter(x,y) >> xlim((0,7|) >> ylim((0,7)) 4. Lorenz curves can have different forms, but for this project, we will fit an exponential curve to our data. Again, we can use Matlab to do this (make sure you have the Matlab curve fitting package installed). We can do this using the following command: >>f-fit(x.y,'expl') What is your exponential Lorenz curve? 5. Now produce a plot of your data and your Lorenz curve. This can be done using the Matlab command >> plot(f.x.y) Be sure to label your axes, Page < 2 > of 3 below the perfect income distribution curve - why?) 9. Write down a definite integral that represents the area A and compute this area. 10. The Gini Index. Denote the area beneath the Lorenz curve and above the x-axis by B. TI Gini Index is simply A A+B Compute the Gini Index for your Lorenz function. What is the range for the Gini index What does a Gini value of 1 mean? What does a Gini value near 0 mean? For comparisor the Gini index for the LPGA (Ladies Professional Golf Index) was 0.52 in 2012, and the Gir Index for the NFL (National Football League) was 0.55 in 2015. (Gini Index estimates fo various countries (World Bank): Brazil .53, Mexico .43, Nigeria 43, United States 41, Canad. 34, Germany .31, Sweden .29, Denmark .28)
Step by Step Solution
★★★★★
3.54 Rating (144 Votes )
There are 3 Steps involved in it
Step: 1
1 To construct a Lorenz curve for NBA players using the salary data provided we need to calculate th...
Get Instant Access to Expert-Tailored Solutions
See step-by-step solutions with expert insights and AI powered tools for academic success
Step: 2

Step: 3
Ace Your Homework with AI
Get the answers you need in no time with our AI-driven, step-by-step assistance
Get Started
College Mathematics For Business Economics, Life Sciences, And Social Sciences
Authors: Raymond Barnett, Michael Ziegler, Karl Byleen, Christopher Stocker
14th Edition
0134674146, 978-0134674148