

Question
Pageof 2 ZOOM import random import math from matplotlib import pyplot as plt def normpdf(x, mean, sd): Return the value of the normal distribution
Pageof 2
ZOOM
import random
import math
from matplotlib import pyplot as plt
def normpdf(x, mean, sd):
"""
Return the value of the normal distribution
with the specified mean and standard deviation (sd) at
position x.
You do not have to understand how this function works exactly.
"""
var = float(sd)**2
denom = (2*math.pi*var)**.5
num = math.exp(-(float(x)-float(mean))**2/(2*var))
return num/denom
def pdeath(x, mean, sd):
start = x-0.5
end = x+0.5
step =0.01
integral = 0.0
while start
integral += step * (normpdf(start,mean,sd) +
normpdf(start+step,mean,sd)) / 2
start += step
return integral
recovery_time = 4 # recovery time in time-steps
virality = 0.2 # probability that a neighbor cell is infected in
# each time step
class Cell(object):
def __init__(self,x, y):
self.x = x
self.y = y
self.state = "S" # can be "S" (susceptible), "R" (resistant =
dead), or
# "I" (infected)
def infect(self):
pass
class Map(object):
def __init__(self):
self.height = 150
self.width = 150
self.cells = {}
def add_cell(self, cell):
pass
def display(self):
pass
def adjacent_cells(self, x,y):
pass
def read_map(filename):
m = Map()
# ... Write this function
return m
pass
def adjacent_cells(self, x,y):
pass
def read_map(filename):
m = Map()
# ... Write this function
return m
We first need to create a model for each cell and then store the cells together into a map. We will use two classes: Cell and Map. Cell has attributes the x and y coordinate of each instance, as well as the current state of this cell as a string ("S"=susceptible, "R"=resistant, "I"=infected). Map is going to be the main class that implements the simulator. The Map has attributes for height and width, as well as a dictionary cells that stores the actual cells on the map. The keys of this dictionary will be tuples of (x,y) coordinates, and the values will be Cell instances.
Write the method add_cell(self, cell) in the Map class. This method takes a cell object as its parameter and inserts it into the cells dictionary.
Write the function read_map(filename). This function should reads in x,y coordinates from a file, create a new Cell instance for each coordinate pair. The function should return a Map instance containing all the cells. The file nyc_map.csv contains the coordinates for each cell of the 150x150 New York City map in comma separated value format.
Next, write the method display(self) in the Map class. To display the map, we will use matplotlib (a graph plotting package, which we will discuss in class). To plot the map, we first need to turn the data in the map into a suitable format, described below, and then call matplotlib to display it in the IPython console (this is why you need to use Spyder for this assignment). To display the map, you can use the line plt.imshow(image). matplotlib requires the image to be in the following data format:
Each cell on the map will be displayed as one pixel. Each pixel is represented by a (Red,Green,Blue) tuple indicating the color of the pixel. The values for each color is a float ranging between 0 and 1. So (0.0, 0.0, 0.0) stands for a black pixel, (1.0, 0.0, 0.0) stands for a red pixel, (0.0, 1.0, 0.0) stands for a green pixel and (0.5, 0.5, 0.5) stands for a gray pixel.
A single row of pixels is simply a Python list of 150 of such pixel tuples.
The complete image is a Python list, containing 150 rows (i.e. the image is a list of lists).
Each cell should be displayed in the color that represents its state: green if the state is S, red if the state is I and gray if the state is R. Pixels in the image that do not correspond to a cell on the map should be displayed in black.
You should now be able to run your program, which will load the class and function definitions and then type the following into the IPython console: 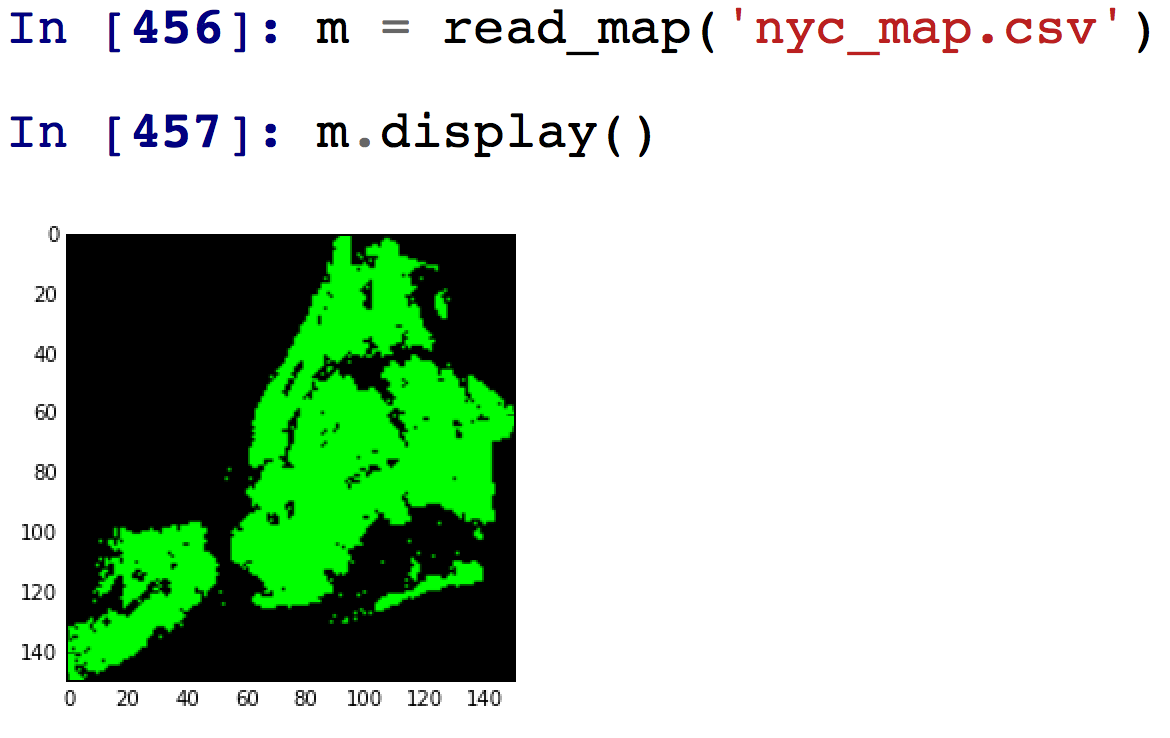
Step by Step Solution
There are 3 Steps involved in it
Step: 1

Get Instant Access to Expert-Tailored Solutions
See step-by-step solutions with expert insights and AI powered tools for academic success
Step: 2

Step: 3
Ace Your Homework with AI
Get the answers you need in no time with our AI-driven, step-by-step assistance
Get Started
AutoCAD Database Connectivity
Authors: Scott McFarlane
1st Edition
0766816400, 978-0766816404