Answered step by step
Verified Expert Solution
Link Copied!

Question

1 Approved Answer

Paltel Company started its operations in Palestine in 1997, as a public shareholding company, by providing services to the Palestinian end user. Its variety of

Paltel Company started its operations in Palestine in 1997, as a public shareholding company, by providing services to the Palestinian end user. Its variety of services includes local and international fixed-telephony services, internet, data communications, mobile services, and next-generation services. Today, Paltel Group includes the parent company (Paltel Company) and a number of subsidiaries. The complete annual report of Paltel Group, including the notes to the financial statements, are available on the Groups website. Using the Groups financial information included in its annual report, answer the following questions.
a) List the names of Paltel Companys subsidiaries and the companys percentage of ownership in each subsidiary.
b) What is the par value of Paltel Companys common stock?
c) What percentage of authorized shares was issued by Paltel Company at December 31, 2019?
d) Are there any treasury stock held by Paltel Company at December 31, 2019?
e) How many Paltel Company common shares are outstanding at December 31, 2019?
f) What amounts of cash dividends per share were declared by Paltel Co. in 2018? What was the dollar amount effect of the cash dividends on the companys stockholders equity?
g) What is Paltel Groups rate of return on common stockholders equity for 2019 and 2018?
h) What is Paltel Groups payout ratio for 2018?
i) What is Paltel Groups book value per share for 2019 and 2018?
j) Are there any restrictions on Paltel Groups retained earnings for 2019? If yes, list each type of restriction and its amount.
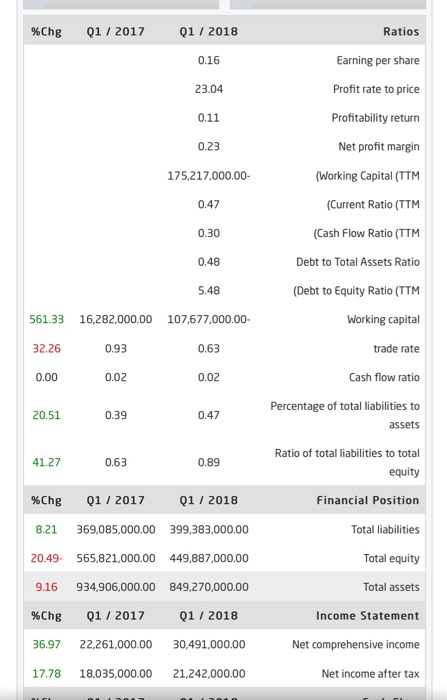
image text in transcribed
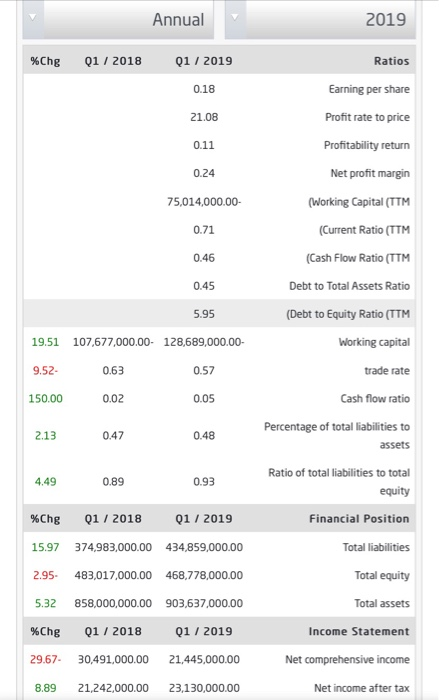
%Chg 01 / 2017 01 / 2018 Ratios 0.16 Earning per share 23.04 Profit rate to price 0.11 Profitability return 0.23 Net profit margin 175,217,000.00 (Working Capital (TTM 0.47 (Current Ratio (TTM 0.30 (Cash Flow Ratio (TTM 0.48 Debt to Total Assets Ratio 5.48 (Debt to Equity Ratio (TTM 561.33 16,282,000.00 107,677,000.00 Working capital 32.26 0.93 0.63 trade rate 0.00 0.02 0.02 Cash flow ratio 20.51 0.39 0.47 Percentage of total liabilities to assets 41.27 0.63 0.89 Ratio of total liabilities to total equity %Chg 01 / 2017 01 / 2018 Financial Position 8.21 369,085,000.00 399,383,000.00 Total liabilities 20.49. 565,821,000.00 449,887,000.00 Total equity Total assets 9.16 %Chg 934,906,000.00 849,270,000.00 01 / 2017 01 / 2018 Income Statement 36.97 22,261,000.00 30,491,000.00 Net comprehensive income 17.78 18,035,000.00 21,242,000.00 Net income after tax Annual 2019 %Chg 01 / 2018 01 / 2019 Ratios 0.18 Earning per share 21.08 Profit rate to price 0.11 Profitability return 0.24 Net profit margin 75,014,000.00 (Working Capital (TTM 0.71 (Current Ratio (TTM 0.46 (Cash Flow Ratio (TTM 0.45 Debt to Total Assets Ratio 5.95 (Debt to Equity Ratio (TTM 19.51 Working capital 9.52 107,677,000.00- 128,689,000.00- 0.63 0.57 0.02 0.05 trade rate 150.00 Cash flow ratio 2.13 0.47 0.48 Percentage of total liabilities to assets 4.490 .89 0.93 Ratio of total liabilities to total equity %Chg 01 / 2018 01 / 2019 Financial Position 15.97 374,983,000.00 434,859,000.00 Total liabilities 2.95- 483,017,000.00 468,778,000.00 Total equity 5.32 858,000,000.00 903,637,000.00 Total assets %Chg 01 / 2018 01 / 2019 Income Statement 29.67. 30,491,000.00 21,445,000.00 Net comprehensive income 8.89 21.242,000.00 23,130,000.00 Net income after tax %Chg 01 / 2017 01 / 2018 Ratios 0.16 Earning per share 23.04 Profit rate to price 0.11 Profitability return 0.23 Net profit margin 175,217,000.00 (Working Capital (TTM 0.47 (Current Ratio (TTM 0.30 (Cash Flow Ratio (TTM 0.48 Debt to Total Assets Ratio 5.48 (Debt to Equity Ratio (TTM 561.33 16,282,000.00 107,677,000.00 Working capital 32.26 0.93 0.63 trade rate 0.00 0.02 0.02 Cash flow ratio 20.51 0.39 0.47 Percentage of total liabilities to assets 41.27 0.63 0.89 Ratio of total liabilities to total equity %Chg 01 / 2017 01 / 2018 Financial Position 8.21 369,085,000.00 399,383,000.00 Total liabilities 20.49. 565,821,000.00 449,887,000.00 Total equity Total assets 9.16 %Chg 934,906,000.00 849,270,000.00 01 / 2017 01 / 2018 Income Statement 36.97 22,261,000.00 30,491,000.00 Net comprehensive income 17.78 18,035,000.00 21,242,000.00 Net income after tax Annual 2019 %Chg 01 / 2018 01 / 2019 Ratios 0.18 Earning per share 21.08 Profit rate to price 0.11 Profitability return 0.24 Net profit margin 75,014,000.00 (Working Capital (TTM 0.71 (Current Ratio (TTM 0.46 (Cash Flow Ratio (TTM 0.45 Debt to Total Assets Ratio 5.95 (Debt to Equity Ratio (TTM 19.51 Working capital 9.52 107,677,000.00- 128,689,000.00- 0.63 0.57 0.02 0.05 trade rate 150.00 Cash flow ratio 2.13 0.47 0.48 Percentage of total liabilities to assets 4.490 .89 0.93 Ratio of total liabilities to total equity %Chg 01 / 2018 01 / 2019 Financial Position 15.97 374,983,000.00 434,859,000.00 Total liabilities 2.95- 483,017,000.00 468,778,000.00 Total equity 5.32 858,000,000.00 903,637,000.00 Total assets %Chg 01 / 2018 01 / 2019 Income Statement 29.67. 30,491,000.00 21,445,000.00 Net comprehensive income 8.89 21.242,000.00 23,130,000.00 Net income after tax

Step by Step Solution

There are 3 Steps involved in it

Step: 1

blur-text-image

Get Instant Access to Expert-Tailored Solutions

See step-by-step solutions with expert insights and AI powered tools for academic success

Step: 2

blur-text-image_2

Step: 3

blur-text-image_3

Ace Your Homework with AI

Get the answers you need in no time with our AI-driven, step-by-step assistance

Get Started

Students also viewed these Accounting questions