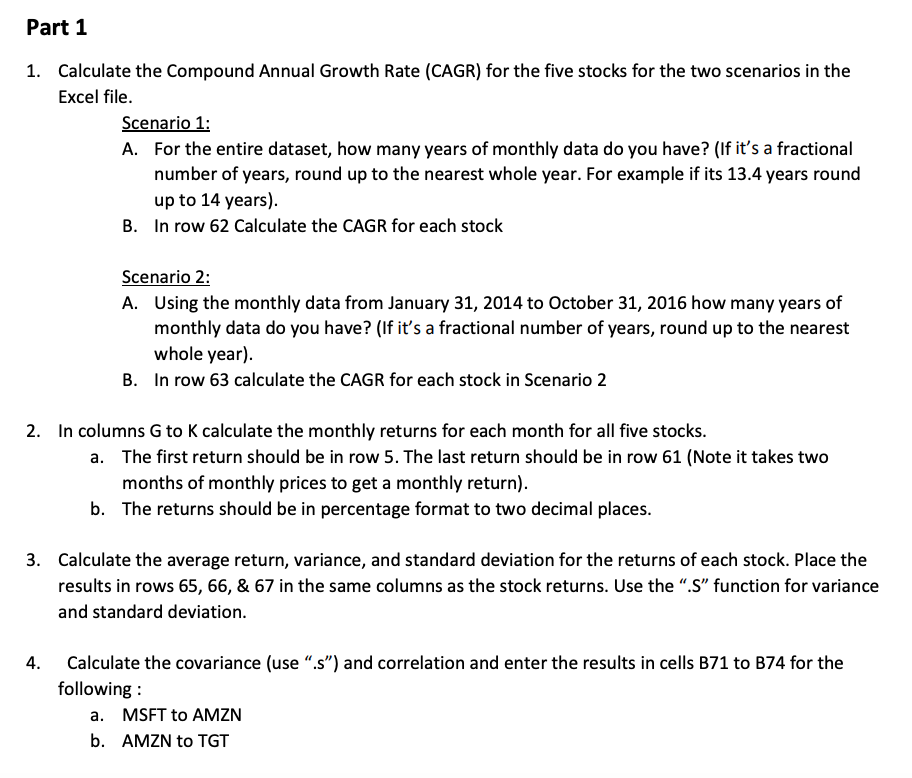
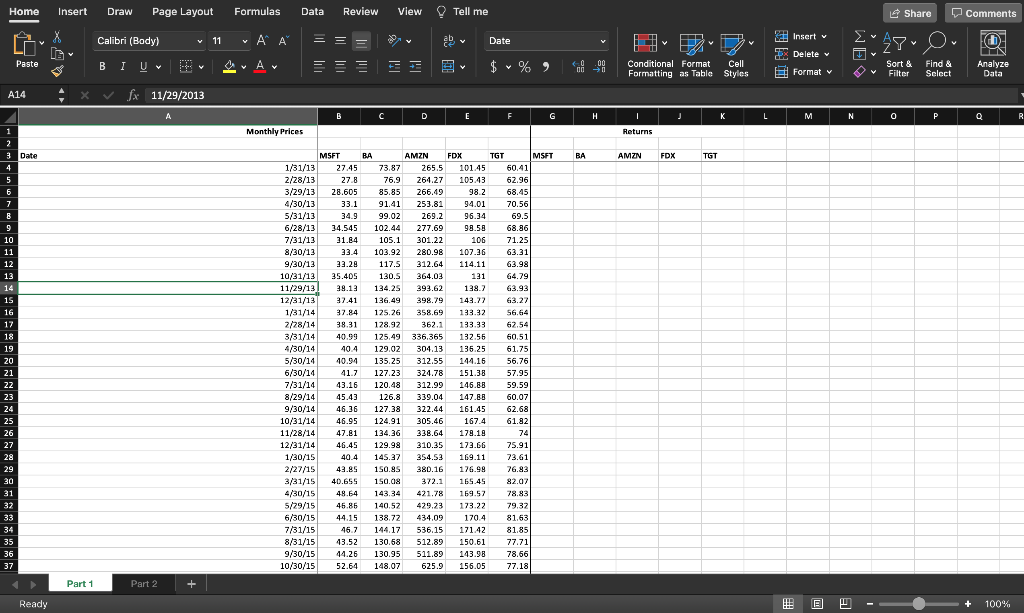

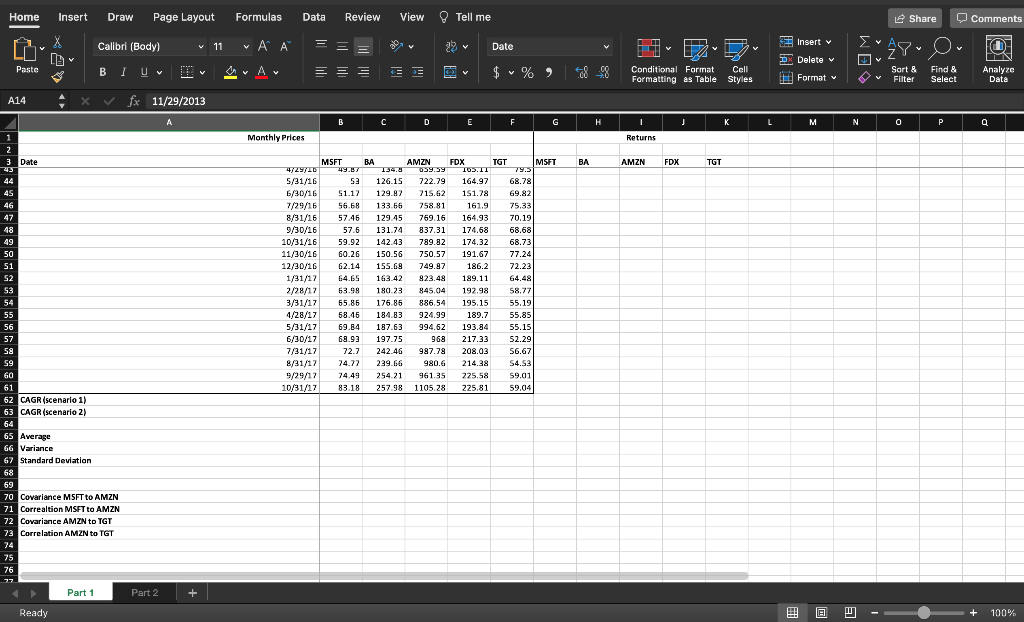
Part 1 1. Calculate the Compound Annual Growth Rate (CAGR) for the five stocks for the two scenarios in the Excel file. Scenario 1: A. For the entire dataset, how many years of monthly data do you have? (If it's a fractional number of years, round up to the nearest whole year. For example if its 13.4 years round up to 14 years). B. In row 62 Calculate the CAGR for each stock Scenario 2: A. Using the monthly data from January 31, 2014 to October 31, 2016 how many years of monthly data do you have? (If it's a fractional number of years, round up to the nearest whole year). B. In row 63 calculate the CAGR for each stock in Scenario 2 2. In columns G to K calculate the monthly returns for each month for all five stocks. a. The first return should be in row 5. The last return should be in row 61 (Note it takes two months of monthly prices to get a monthly return). b. The returns should be in percentage format to two decimal places. 3. Calculate the average return, variance, and standard deviation for the returns of each stock. Place the results in rows 65, 66, & 67 in the same columns as the stock returns. Use the .S function for variance and standard deviation. 4. Calculate the covariance (use.s) and correlation and enter the results in cells B71 to 374 for the following: a. MSFT to AMZN b. AMZN to TGT Home Insert Draw Page Layout Formulas Data Review View Tell me Share Comments Calibri (Body) Insert v 11 A Date vi T Ayu O D DX Delete v Paste a. Ar V += = $ % ) 00 00 Conditional Format Cell Formatting as Table Styles El Format Sort & Filter Find & Select Analyze Data A14 fx 11/29/2013 B C D E F G H K L M N 0 P R 1 Monthly Prices Returns 2 3 Date BA AMZN FDX BA AMZN FDX TGT TGT MSFT 60.41 4 73.87 265.5 101.45 5 76.9 261.27 105.43 62.96 6 85.85 266.49 98.2 68.45 7 91.41 253.81 94.01 70.56 MSFT 1/31/13 27.45 2/28/13 27.8 3/29/13 28.605 4/30/13 33.1 5/31/13 34.9 6/28/13 34.545 7/31/13 31.84 8/30/13 23.4 9/30/12 32.28 8 99.02 269.2 96.34 69.5 9 102.44 277.69 98.58 68.86 10 105.1 301.22 106 71.25 11 103.92 280.98 107.36 63.31 12 117.5 312.64 114.11 63.98 13 10/31/13 35.405 130.5 364.03 131 64.79 14 11/29/13 29.12 134.25 393.62 138.2 63.93 15 12/31/13 37.41 136.49 398.79 143.77 63.27 16 1/31/14 37.84 125.26 358.69 133.32 56.64 17 38.31 178,92 362.1 133.33 62.54 18 40.99 125.49 336.365 132.55 60.51 19 40.4 129.02 304.13 135.25 61.75 20 40.94 135.25 312.55 144.16 56.76 21 2/28/14 3/31/14 4/30/14 5/30/14 6/30/14 7/31/14 8/29/14 9/30/14 10/31/14 41.7 127.23 324.78 151.38 57.95 22 43.16 120.48 312.99 146.88 59.59 23 45.43 126.8 339.04 147.88 60.07 24 46.36 127.38 322.44 161.45 62.68 25 46.95 124.91 305.46 167.4 61.82 26 11/28/14 47.81 134.36 338.64 179.18 74 27 12/31/14 46.45 129.98 310.35 173.66 75.91 28 1/30/15 145.37 354.53 169.11 73.61 40.4 43.85 29 2/27/15 150.85 380.16 176.98 76.83 30 3/31/15 40.655 150.08 372.1 165.45 82.07 31 4/30/15 48.54 143.34 421.78 159.52 78.83 32 140.52 429.23 173.22 79.32 44.15 138.72 434.09 170.4 81.63 34 144.17 536.15 171.42 81.85 5/29/15 6/30/15 7/31/15 8/31/15 9/30/15 10/30/15 35 43.52 130.58 512.89 150.61 77.71 36 44.26 130.95 511.89 143.98 78.66 37 52.64 148.07 625.9 156.05 77.18 Part 1 Part 2 + Ready 100% Home Insert Draw Page Layout Formulas Data Review View Tell me Share 0 Comments Insert v Calibri (Body) A v 11 = Date 7D (b DX Delete v Paste = = = BI UV OVA $ % Conditional Format Cell Sort & Filter Formatting as Table Styles ! Format Find & Select Analyze Data A14 fx 11/29/2013 A C D E F J L M N 0 P R Monthly Prices Returns 3 Date MSFT BA AMZN FDX TGT MSET BA AMZN FDX TGT 37 52.64 149.07 625.9 156.05 77.18 38 10/30/15 11/30/15 12/31/15 54.35 145.45 664.8 159.54 72.5 39 55.48 144.59 149.99 72.61 675.89 587 40 1/29/16 55.09 120.13 132.88 72.42 41 2/29/16 50.88 119.19 552.52 136.89 78.45 42 3/31/16 55.23 126.94 593.64 162.72 82.28 43 4/29/16 49.87 134.9 659.59 165.11 79.5 44 5/31/16 S3 126.15 722.79 164.97 68.78 45 6/30/16 51.17 129.87 715.62 151.79 69.82 46 7/29/16 56.68 133.66 758.81 161.9 75.33 47 8/31/16 57.46 129.45 769.16 164.92 70.19 48 9/30/16 57.6 131.74 837.31 174.69 68.68 49 59.92 142.43 789.82 174.32 68.73 SO 60.26 150.56 750.57 191.67 77.24 51 62.14 155.68 749.87 186.2 72.23 52 64.65 163.42 823.48 199.11 64.48 53 63.98 180.23 845.04 192.98 58.77 54 65.86 175.85 886,54 195.15 55.19 55 10/31/16 11/30/16 12/30/16 1/31/17 2/28/17 3/31/17 4/28/17 5/31/17 6/30/17 7/31/17 8/31/17 9/29/17 10/31/17 68,46 184.83 924.99 189.7 55.85 56 69.84 187.63 994,62 193.84 55.15 57 68.93 197.75 968 217.33 52.29 58 72.7 242.45 987.78 208.03 56.67 59 74.77 239.66 980.6 214.38 54.53 60 74,49 254.21 961.35 225.58 59.01 83.18 257.98 1105.28 225.81 59.04 61 62 CAGR scenario 1) 63 CAGR (scenario 2) 64 65 Average 66 Variance 67 Standard Deviation 68 69 70 Covariance MSFT to AMZN Part 1 Part 2 + Ready 100% Home Insert Draw Page Layout Formulas Data Review View Tell me Share O Comments X Insert v Calibri (Body) v 11 VAI 29 Date H Ev 2 8v O Il DX Delete v Paste B IU = = = v $ % ) Conditional Format Formatting as Table Cell Styles Sort & Filter Format v Find & Select Analyze Data A14 fx 11/29/2013 A C D E F G H K L M N 0 P Q 1 Monthly Prices Returns 2 3 Date BA AMZN FDX TGT MSFT 4729TID 49.87 5/31/16 53 BA AMZN FDX TGT MSFT 134.8 39.39 103.11 79. 126.15 722.79 164.97 68.78 129.97 715.62 151.78 69.82 44 45 51.12 46 56.68 133.56 758.81 161.9 75.33 47 57.45 129.45 769.16 164.93 70.19 48 57.6 131.74 837.31 174.68 68.68 49 59.92 142.43 789.82 174.32 68.73 50 60.26 150.56 750.57 191.67 77.24 51 6/30/16 7/29/16 8/31/16 9/30/16 10/31/16 11/30/16 12/30/16 1/31/17 2/28/17 3/31/17 4/28/17 5/31/17 6/30/17 62.14 155.69 749.97 186.2 72.23 52 64.65 163.42 823.48 189.11 53 63.98 180 23 845.04 192.98 58.77 54 55.86 176.85 886,54 195.15 55.19 55 58.45 184.83 924.99 189.7 55.85 56 69.84 187.63 994.62 193.84 55.15 57 68.93 197.75 968 217.33 52.29 58 7/31/17 72.7 242.46 987.78 208.03 56.67 59 74.72 239.66 980.6 214.38 54.53 60 8/31/17 9/29/17 10/31/17 74.49 254.21 961.35 225.58 59,01 83.18 257.98 1105.28 225.81 59.04 61 62 CAGR scenario 1) 63 CAGR scenario 2) 64 65 Average 66 Variance 67 Standard Deviation 68 69 70 Covariance MSFT to AMZN 71 Correaltion MSFT to AMZN 72 Covariance AMZN to TGT 73 Correlation AMZN to TGT 74 75 76 Part 1 Part 2 + Ready + 100%