part 1 can you conduct horizontal and veryical analysis of thr income statement
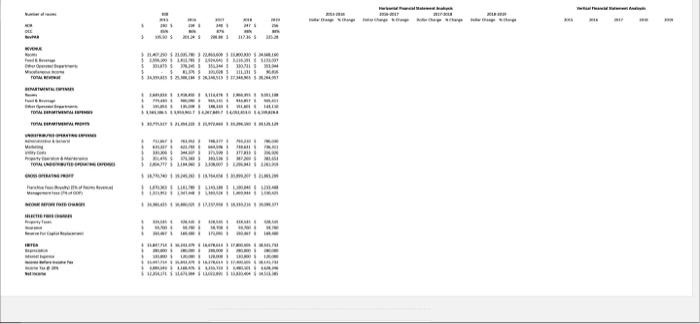
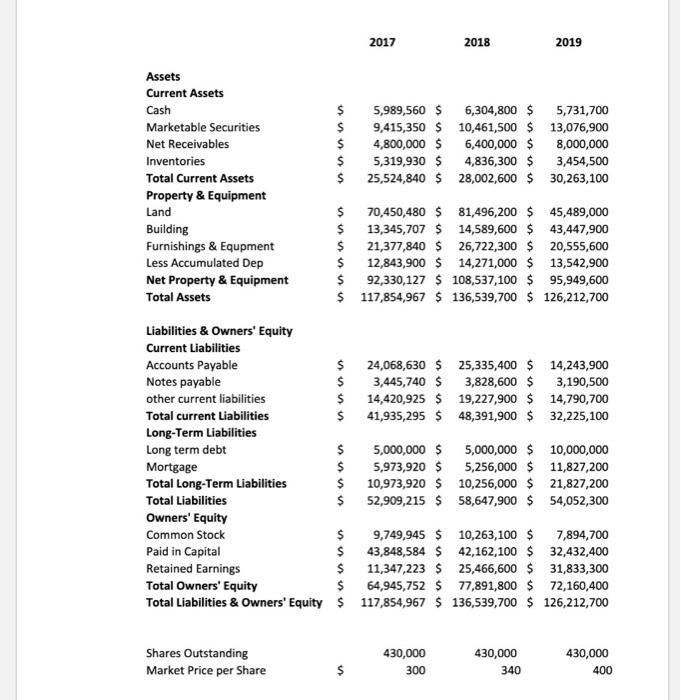
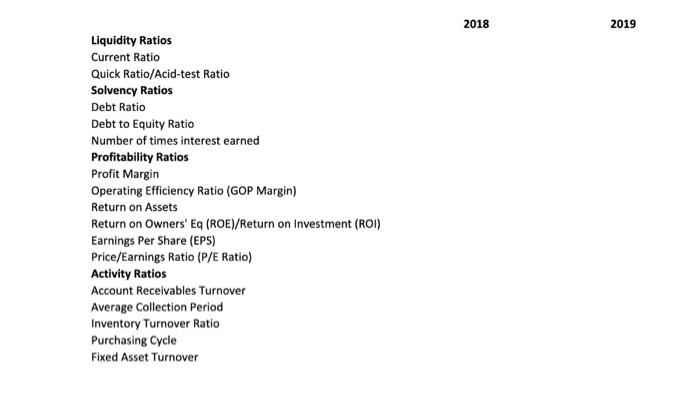
part 2 find the financial ratios for the years 2018 and 2019 based on the given income statement and balmce sheet
2017 2018 2019 Assets Current Assets CashMarketableSecuritiesNetReceivablesInventoriesTotalCurrentAssetsProperty&EquipmentLandBuildingFurnishings&EqupmentLessAccumulatedDepNetProperty&EquipmentTotalAssets$$$$$$$$$$$5,989,5609,415,3504,800,0005,319,93025,524,84070,450,48013,345,70721,377,84012,843,90092,330,127117,854,967$$$$$$$$$$108,537,100$136,539,7006,304,80010,461,5006,400,0004,836,30028,002,60081,496,20014,589,60026,722,30014,271,000$$$$$$$$$$$95,949,600126,212,7005,731,70013,076,9008,000,0003,454,50030,263,10045,489,00043,447,90020,555,60013,542,900 Liabilities \& Owners' Equity Current Liabilities Accounts Payable Notes payable other current liabilities Total current Liabilities Long-Term Liabilities Long term debt Mortgage Total Long-Term Liabilities Total Liabilities Owners' Equity Common Stock Paid in Capital Retained Earnings Total Owners' Equity Total Liabilities \& Owners' Equity \begin{tabular}{|c|c|c|c|c|c|} \hline & 24,068,630 & $ & 25,335,400 & $ & 14, \\ \hline & 3,445,740 & $ & 3,828,600 & $ & 3,190,500 \\ \hline & 14,420,925 & $ & 19,227,900 & $ & 14,790,700 \\ \hline & 41,935,295 & $ & 48,391,900 & $ & 32,225,100 \\ \hline & 5,00 & $ & 5,00 & $ & 10, \\ \hline & 5,973,920 & $ & 5,256,000 & $ & 11,8 \\ \hline & 10,973,920 & $ & 10,256,000 & $ & 21,827,200 \\ \hline & 52,909,215 & $ & 58,647,900 & $ & 54,052,300 \\ \hline & 9,7 & $ & 10,2 & $ & \\ \hline & 43,848,584 & $ & 42,162 & $ & 32,4 \\ \hline & 11,347,223 & $ & 25,466,600 & $ & 31,833,300 \\ \hline & 64,945,752 & $ & 77,891,800 & $ & 72,160,400 \\ \hline & 17,854,967 & $ & 136,539,700 & $ & 126,212,700 \\ \hline \end{tabular} Shares Outstanding Market Price per Share 430,000 430,000 430,000 $ 300 340 400 2018 2019 Liquidity Ratios Current Ratio Quick Ratio/Acid-test Ratio Solvency Ratios Debt Ratio Debt to Equity Ratio Number of times interest earned Profitability Ratios Profit Margin Operating Efficiency Ratio (GOP Margin) Return on Assets Return on Owners' Eq (ROE)/Return on Investment (ROI) Earnings Per Share (EPS) Price/Earnings Ratio (P/E Ratio) Activity Ratios Account Receivables Turnover Average Collection Period Inventory Turnover Ratio Purchasing Cycle Fixed Asset Turnover