

Answered step by step
Verified Expert Solution
Question
1 Approved Answer
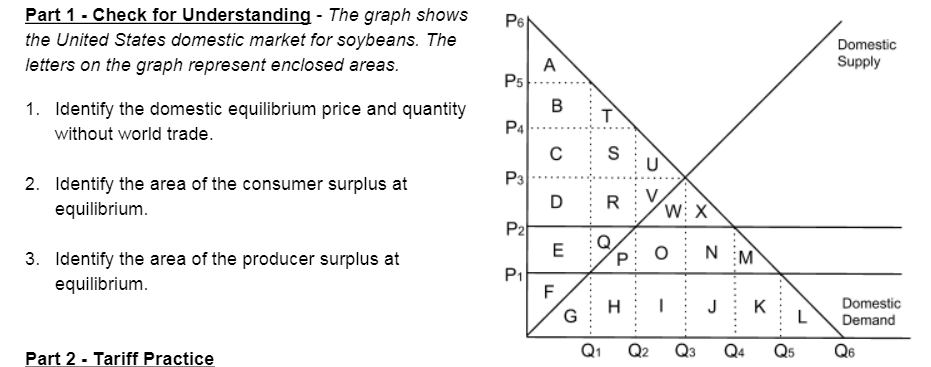
Part 1 - Check for Understanding - The graph shows P6 the United States domestic market for soybeans. The Domestic Supply letters on the graph

Step by Step Solution
There are 3 Steps involved in it
Step: 1

Get Instant Access to Expert-Tailored Solutions
See step-by-step solutions with expert insights and AI powered tools for academic success
Step: 2

Step: 3
Ace Your Homework with AI
Get the answers you need in no time with our AI-driven, step-by-step assistance
Get Started
Research Methods Design And Analysis
Authors: Larry Christensen
13th Edition
0205961258, 978-0205961252