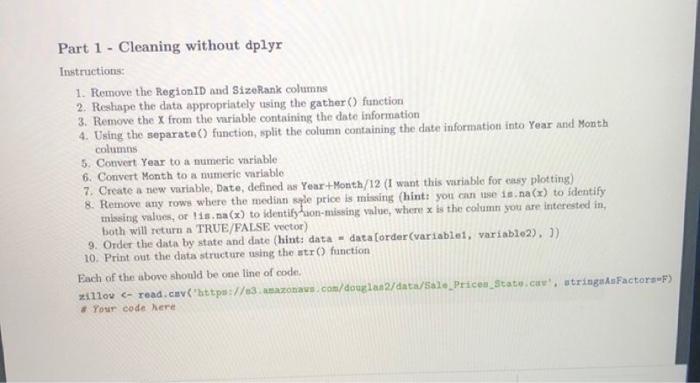
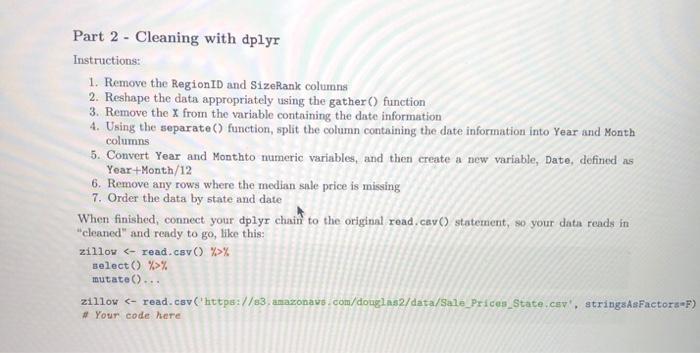
Part 1 - Cleaning without dplyr Instructions: 1. Remove the Region ID and SizeRank columns 2. Reshape the data appropriately using the gather() function 3. Remove the X from the variable containing the date information 4. Using the separate() function, split the column containing the date information into Year and Month columns 5. Convert Year to a numeric variable 6. Convert Month to a numeric variable 7. Create a new variable, Date, defined as Year+Month/12 (I want this variable for easy plotting) 8. Remove any rows where the median spe price is missing (hint: you can use is na(x) to identify missing values, or lisna(x) to identityhuon-missing value, where is the column you are interested in, bot will return a TRUE/FALSE vector) 9. Order the data by state and date (hint: data-data Corder(variablet, variable2), )) 10. Print out the data structure using the str() function Each of the above should be one line of code 11100 Your code here Part 2 - Cleaning with dplyr Instructions: 1. Remove the Region ID and SizeRank columns 2. Reshape the data appropriately using the gather() function 3. Remove the x from the variable containing the date information 4. Using the separate() function, split the column containing the date information into Year and Month columns 5. Convert Year and Monthto numeric variables, and then create a new variable, Date, defined as Year+Month/12 6. Remove any rows where the median sale price is missing 7. Order the data by state and date When finished, connect your dplyr chain to the original read.cav() statement, so your data reads in "cleaned" and ready to go, like this: zillow % select() %>% mutate()... zillow Your code here Part 2 - Cleaning with dplyr Instructions: 1. Remove the Region ID and SizeRank columns 2. Reshape the data appropriately using the gather() function 3. Remove the x from the variable containing the date information 4. Using the separate() function, split the column containing the date information into Year and Month columns 5. Convert Year and Monthto numeric variables, and then create a new variable, Date, defined as Year+Month/12 6. Remove any rows where the median sale price is missing 7. Order the data by state and date When finished, connect your dplyr chain to the original read.cav() statement, so your data reads in "cleaned" and ready to go, like this: zillow % select() %>% mutate()... zillow


