Answered step by step
Verified Expert Solution
Question
1 Approved Answer
Part 1 - Confirming the Problem 1. Compare the original PX measurements with the PX recheck measurements. Does there appear to be a drift

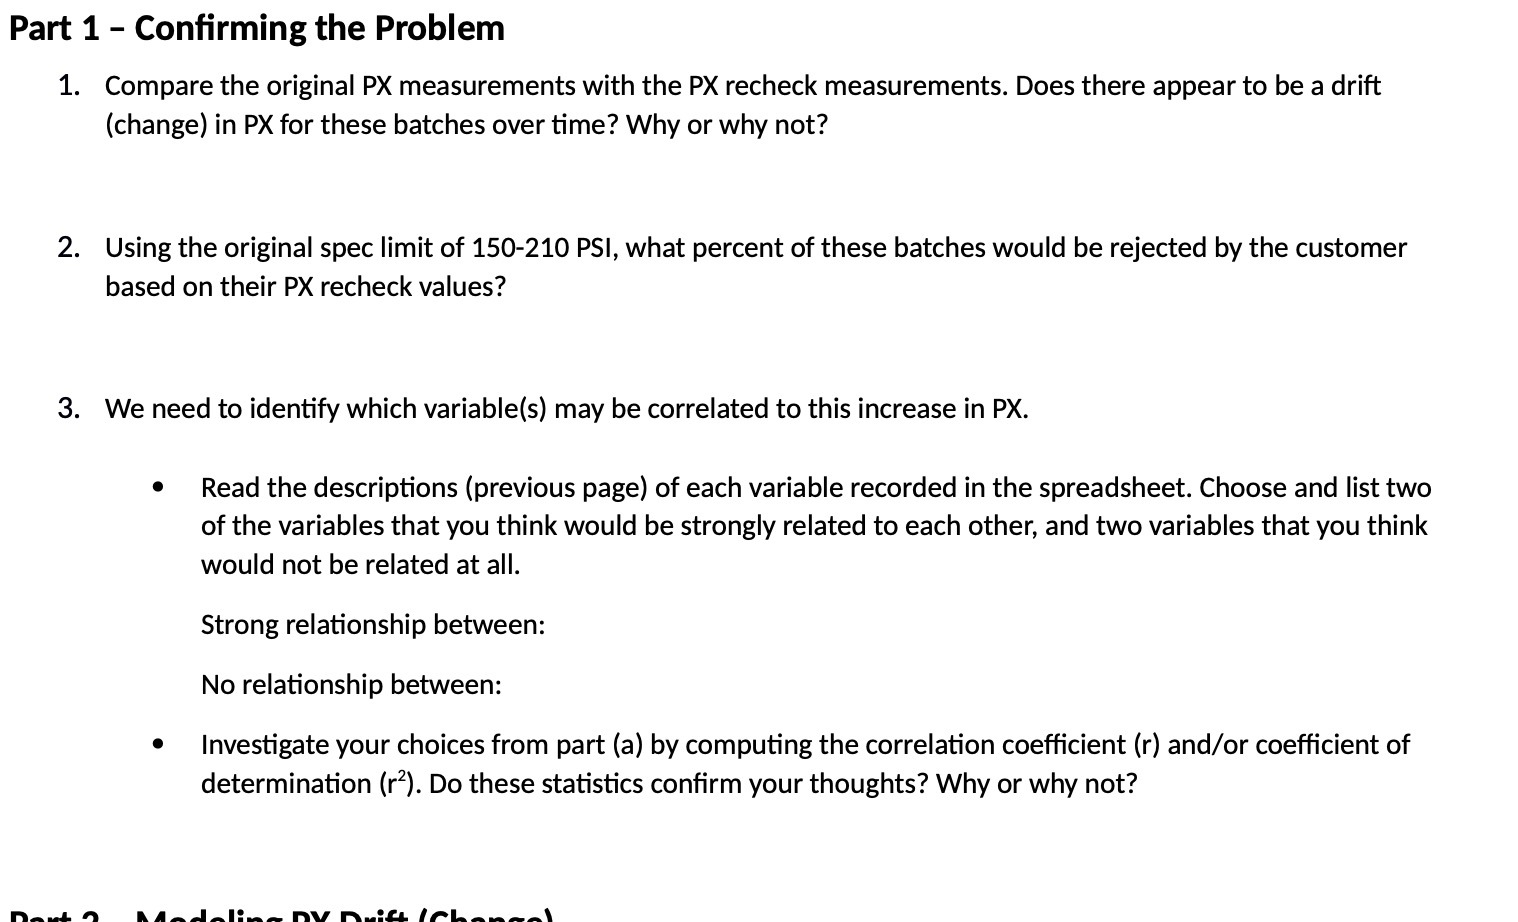
Part 1 - Confirming the Problem 1. Compare the original PX measurements with the PX recheck measurements. Does there appear to be a drift (change) in PX for these batches over time? Why or why not? 2. Using the original spec limit of 150-210 PSI, what percent of these batches would be rejected by the customer based on their PX recheck values? 3. We need to identify which variable(s) may be correlated to this increase in PX. Read the descriptions (previous page) of each variable recorded in the spreadsheet. Choose and list two of the variables that you think would be strongly related to each other, and two variables that you think would not be related at all. Strong relationship between: No relationship between: Investigate your choices from part (a) by computing the correlation coefficient (r) and/or coefficient of determination (r2). Do these statistics confirm your thoughts? Why or why not? Modelin DY Drift (Chancel
Step by Step Solution
There are 3 Steps involved in it
Step: 1
Part 1 Confirming the Problem 1 Comparison of PX Measurements To determine if there is a drift in PX pressure measurement for these batches over time Compare Original and Recheck Measurements Plot the ...
Get Instant Access to Expert-Tailored Solutions
See step-by-step solutions with expert insights and AI powered tools for academic success
Step: 2

Step: 3

Ace Your Homework with AI
Get the answers you need in no time with our AI-driven, step-by-step assistance
Get Started


