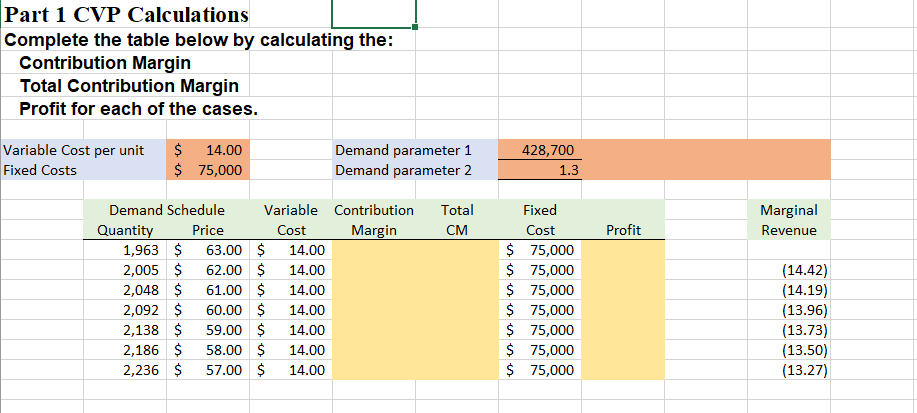
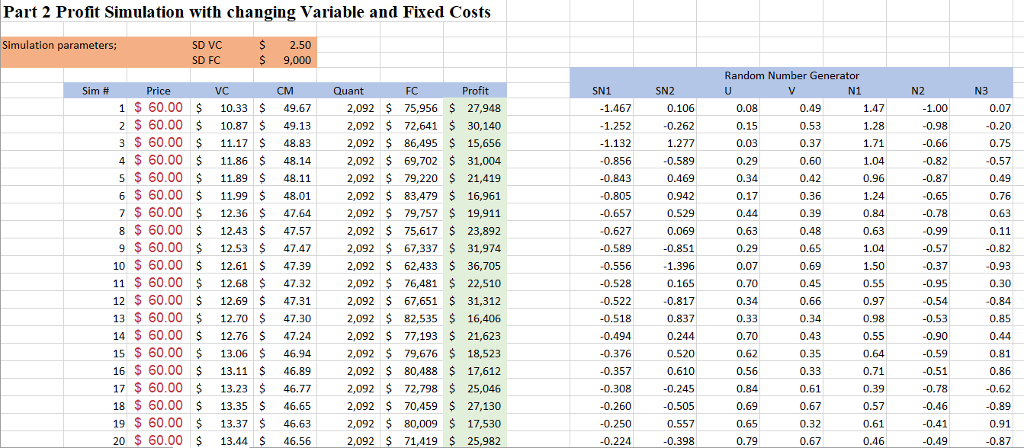
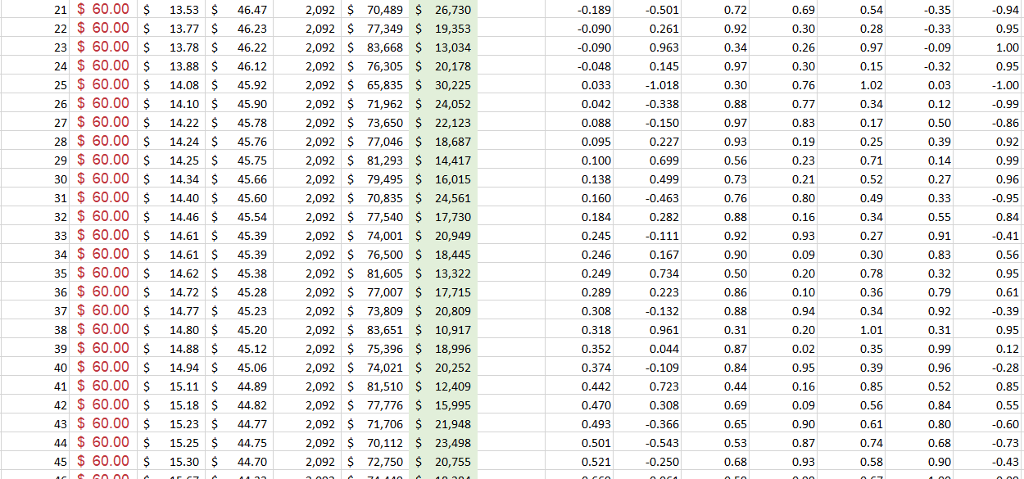
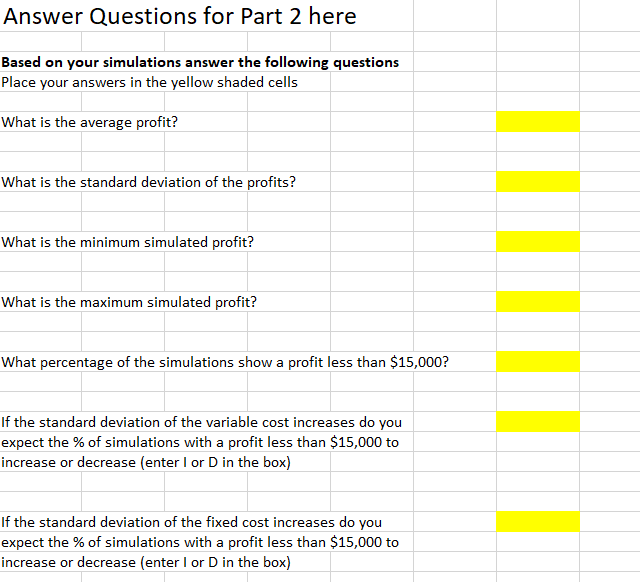
Part 1 CVP Calculations Complete the table below by calculating the: Contribution Margin Total Contribution Margin Profit for each of the cases Variable Cost per unit Fixed Costs $14.00 75,000 Demand parameter 1 Demand parameter 2 428,700 1.3 Demand Schedule Price Variable Contribution Total Fixed Cost $ 75,000 $ 75,000 $ 75,000 $ 75,000 $ 75,000 $ 75,000 $ 75,000 Marginal Quanti Cost Margin CM Profit Revenue 1,963 $ 63.0014.00 2,005 $ 62.00 14.00 2,048 61.00 14.00 2,092 60.00$ 14.00 2,138 59.00 14.00 2,186 $ 58.00 14.00 2,236 $ 57.00 14.00 (14.42) (14.19) (13.96) (13.73) (13.50) 13.27 Part 2 Profit Simulation with changing Variable and Fixed Costs Simulation parameters; 9,000 Random Number Generator 1 S 60.00 10.3349.672,092$ 75,956 27,948 2 $ 60.00 10.87 49.132,092 72,641 30,140 3 60.0011.17$ 48.83 2,092 $ 86,495$ 15,656 4 60.0011.8648.142,092 $ 69,702 $ 31,004 60.00 11.8948.112,092$ 79,220 $ 21,419 6 60.0011.99 48.012,092$ 83,479 16,961 7 60.0012.36 $ 47.642,092$ 79,757 19,911 8 60.00 12.43 47.57 2,092 $ 75,617$ 23,892 9 60.0012.5347.472,092$ 67,337 31,974 10 $ 60.00 12.61$ 47.392,092 5 62,433 $ 36,705 11 60.00$12.68 47.322,092$76,481 22,510 12 $ 60.00 12.6947.312,092 5 67,651$ 31,312 13 60.00$12.70 47.302,092$ 82,535 16,406 2,092 77,193 21,623 15 60.0013.06 46.942,092$ 79,676 18,523 2,092 80,488 17,612 17 $ 60.0013.2346.77 2,092 $ 72,798 25,046 18 $ 60.0013.35 46.65 2,092 $ 70,459 27,130 19 $ 60.0013.37$ 46.6 2,092 80,009 17,530 20 S 60.00 5 13.44 46.5 2,092 5 71,419 25,982 1.467 1.252 1.132 0.856 0.843 0.805 0.657 0.627 -0.262 1.277 -0.589 0.469 0.37 0.529 0.069 0.851 0.84 0.78 0.82 0.93 0.165 0.817 0.837 0.244 0.520 0.560.61 0.610 0.528 3 0.95 0.84 0.518 4 $ 60.0012.76 $ 47.242 -0.376 0.357 16 $ 60.00 13.11 46.89 2 0.78 0.46 0.62 2 0.260 -0.250 0.224 0.505 0.557 -0.398 21 60.00 $ 13.53$ 46.47 2,092$ 70,489 26,730 22 60.00 $ 13.77S 46.23 2,092$ 77,349 19,353 23 $ 60.00 S 13.78 S 46.22,092 S 83,668 13,034 24 $ 60.00 $ 13.88 46.12 2,092 $ 76,305 $ 20,178 25 $ 60.00 14.08$ 45.9 2,092 $ 65,835 30,225 26 $ 60.00 14.10$ 5.2,092$ 71,962 $ 24,052 27 60.00$ 14.22$ 45.78 2,092$ 73,650 $ 22,123 28 60.00 $ 14.24 S 45.762,092$ 77,046 18,687 29 60.00 S 14.25 $ 45.75 2,092 S 81,293 $ 14,417 0 $ 60.00 $ 14.34 $ 45.66 2,092 $ 79,495 16,015 31 $ 60.00 14.40 45.602,092 $ 70,835 24,561 32 $ 60.00 14.46$ 5.542,092$ 77,540 $ 17,730 33$ 60.0014.61$ 45.92,092$ 74,001 $ 20,949 34 60.00 $ 14.61 S 45.392,092$ 76,500 18,445 35 60.00 S 14.62 $ 45.38 2,092 S 81,605 S 13,322 36 $ 60.00 $ 14.72$ 458 2,092 77,007 17,715 37 $ 60.00 14.77 453 2,092 $ 73,809 20,809 38 $ 60.00 $14.80 $ 45.20 2,092$ 83,651 10,91:7 39 60.0014.88 $ 45.122,092$ 75,396 $ 18,996 40 60.00 $ 14.94 S 45.062,092$ 74,021 20,252 41 $ 60.00 S 15.11 S 44.89 2,092 S 81,510 12,409 42 $ 60.00 $ 15.18 44.822,092 $ 77,776 $ 15,995 43 $ 60.00 15.23$ 4.7 2,092 $ 71,706 $ 21,948 4 60.00 $15.25 44.752,092$ 70,112 23,498 45 60.00 $ 15.30$ 44.702,092$ 72,750 20,755 0.94 0.261 2 0.090 0.09 0.033 -0.338 0.99 0.282 0.245 0.167 2 0.289 0.223 0.723 0.73 0.521 Answer Questions for Part 2 here Based on your simulations answer the following questions Place your answers in the yellow shaded cells What is the average profit? What is the standard deviation of the profits? What is the minimum simulated profit? What is the maximum simulated profit? What percentage of the simulations show a profit less than $15,000? If the standard deviation of the variable cost increases do you expect the % of simulations with a profit less than $15,000 to increase or decrease (enter I or D in the box) If the standard deviation of the fixed cost increases do you expect the % of simulations with a profit less than $15,000 to increase or decrease (enter I or D in the box) Part 1 CVP Calculations Complete the table below by calculating the: Contribution Margin Total Contribution Margin Profit for each of the cases Variable Cost per unit Fixed Costs $14.00 75,000 Demand parameter 1 Demand parameter 2 428,700 1.3 Demand Schedule Price Variable Contribution Total Fixed Cost $ 75,000 $ 75,000 $ 75,000 $ 75,000 $ 75,000 $ 75,000 $ 75,000 Marginal Quanti Cost Margin CM Profit Revenue 1,963 $ 63.0014.00 2,005 $ 62.00 14.00 2,048 61.00 14.00 2,092 60.00$ 14.00 2,138 59.00 14.00 2,186 $ 58.00 14.00 2,236 $ 57.00 14.00 (14.42) (14.19) (13.96) (13.73) (13.50) 13.27 Part 2 Profit Simulation with changing Variable and Fixed Costs Simulation parameters; 9,000 Random Number Generator 1 S 60.00 10.3349.672,092$ 75,956 27,948 2 $ 60.00 10.87 49.132,092 72,641 30,140 3 60.0011.17$ 48.83 2,092 $ 86,495$ 15,656 4 60.0011.8648.142,092 $ 69,702 $ 31,004 60.00 11.8948.112,092$ 79,220 $ 21,419 6 60.0011.99 48.012,092$ 83,479 16,961 7 60.0012.36 $ 47.642,092$ 79,757 19,911 8 60.00 12.43 47.57 2,092 $ 75,617$ 23,892 9 60.0012.5347.472,092$ 67,337 31,974 10 $ 60.00 12.61$ 47.392,092 5 62,433 $ 36,705 11 60.00$12.68 47.322,092$76,481 22,510 12 $ 60.00 12.6947.312,092 5 67,651$ 31,312 13 60.00$12.70 47.302,092$ 82,535 16,406 2,092 77,193 21,623 15 60.0013.06 46.942,092$ 79,676 18,523 2,092 80,488 17,612 17 $ 60.0013.2346.77 2,092 $ 72,798 25,046 18 $ 60.0013.35 46.65 2,092 $ 70,459 27,130 19 $ 60.0013.37$ 46.6 2,092 80,009 17,530 20 S 60.00 5 13.44 46.5 2,092 5 71,419 25,982 1.467 1.252 1.132 0.856 0.843 0.805 0.657 0.627 -0.262 1.277 -0.589 0.469 0.37 0.529 0.069 0.851 0.84 0.78 0.82 0.93 0.165 0.817 0.837 0.244 0.520 0.560.61 0.610 0.528 3 0.95 0.84 0.518 4 $ 60.0012.76 $ 47.242 -0.376 0.357 16 $ 60.00 13.11 46.89 2 0.78 0.46 0.62 2 0.260 -0.250 0.224 0.505 0.557 -0.398 21 60.00 $ 13.53$ 46.47 2,092$ 70,489 26,730 22 60.00 $ 13.77S 46.23 2,092$ 77,349 19,353 23 $ 60.00 S 13.78 S 46.22,092 S 83,668 13,034 24 $ 60.00 $ 13.88 46.12 2,092 $ 76,305 $ 20,178 25 $ 60.00 14.08$ 45.9 2,092 $ 65,835 30,225 26 $ 60.00 14.10$ 5.2,092$ 71,962 $ 24,052 27 60.00$ 14.22$ 45.78 2,092$ 73,650 $ 22,123 28 60.00 $ 14.24 S 45.762,092$ 77,046 18,687 29 60.00 S 14.25 $ 45.75 2,092 S 81,293 $ 14,417 0 $ 60.00 $ 14.34 $ 45.66 2,092 $ 79,495 16,015 31 $ 60.00 14.40 45.602,092 $ 70,835 24,561 32 $ 60.00 14.46$ 5.542,092$ 77,540 $ 17,730 33$ 60.0014.61$ 45.92,092$ 74,001 $ 20,949 34 60.00 $ 14.61 S 45.392,092$ 76,500 18,445 35 60.00 S 14.62 $ 45.38 2,092 S 81,605 S 13,322 36 $ 60.00 $ 14.72$ 458 2,092 77,007 17,715 37 $ 60.00 14.77 453 2,092 $ 73,809 20,809 38 $ 60.00 $14.80 $ 45.20 2,092$ 83,651 10,91:7 39 60.0014.88 $ 45.122,092$ 75,396 $ 18,996 40 60.00 $ 14.94 S 45.062,092$ 74,021 20,252 41 $ 60.00 S 15.11 S 44.89 2,092 S 81,510 12,409 42 $ 60.00 $ 15.18 44.822,092 $ 77,776 $ 15,995 43 $ 60.00 15.23$ 4.7 2,092 $ 71,706 $ 21,948 4 60.00 $15.25 44.752,092$ 70,112 23,498 45 60.00 $ 15.30$ 44.702,092$ 72,750 20,755 0.94 0.261 2 0.090 0.09 0.033 -0.338 0.99 0.282 0.245 0.167 2 0.289 0.223 0.723 0.73 0.521 Answer Questions for Part 2 here Based on your simulations answer the following questions Place your answers in the yellow shaded cells What is the average profit? What is the standard deviation of the profits? What is the minimum simulated profit? What is the maximum simulated profit? What percentage of the simulations show a profit less than $15,000? If the standard deviation of the variable cost increases do you expect the % of simulations with a profit less than $15,000 to increase or decrease (enter I or D in the box) If the standard deviation of the fixed cost increases do you expect the % of simulations with a profit less than $15,000 to increase or decrease (enter I or D in the box)