

Answered step by step
Verified Expert Solution
Question
1 Approved Answer
Part 1 - Draw a flowchart that gets temperature and wind speed from user, then calculates and displays the wind - chill index. a .
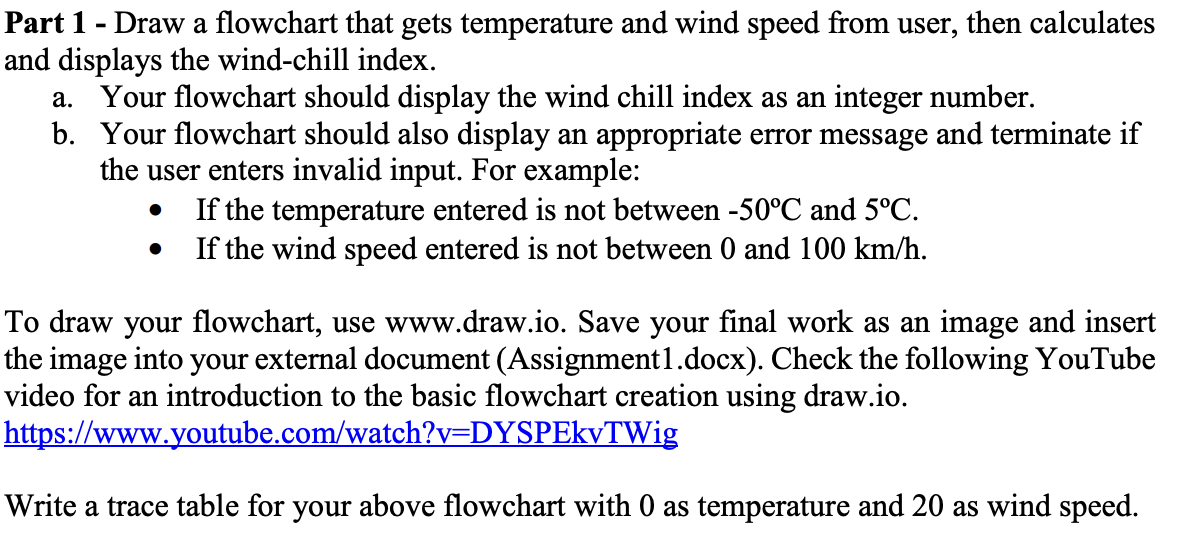
Part Draw a flowchart that gets temperature and wind speed from user, then calculates
and displays the windchill index.
a Your flowchart should display the wind chill index as an integer number.
b Your flowchart should also display an appropriate error message and terminate if
the user enters invalid input. For example:
If the temperature entered is not between and
If the wind speed entered is not between and
To draw your flowchart, use
wwwdraw.io Save your final work as an image and insert
the image into your external document Assignmentdocx Check the following YouTube
video for an introduction to the basic flowchart creation using
draw.io
https:wwwyoutube.comwatchvDYSPEkvTWig
Write a trace table for your above flowchart with as temperature and as wind speed. Write this in Java.
Step by Step Solution
There are 3 Steps involved in it
Step: 1

Get Instant Access to Expert-Tailored Solutions
See step-by-step solutions with expert insights and AI powered tools for academic success
Step: 2

Step: 3
Ace Your Homework with AI
Get the answers you need in no time with our AI-driven, step-by-step assistance
Get Started
The Structure Of The Relational Database Model
Authors: Jan Paredaens ,Paul De Bra ,Marc Gyssens ,Dirk Van Gucht
1st Edition
3642699588, 978-3642699580