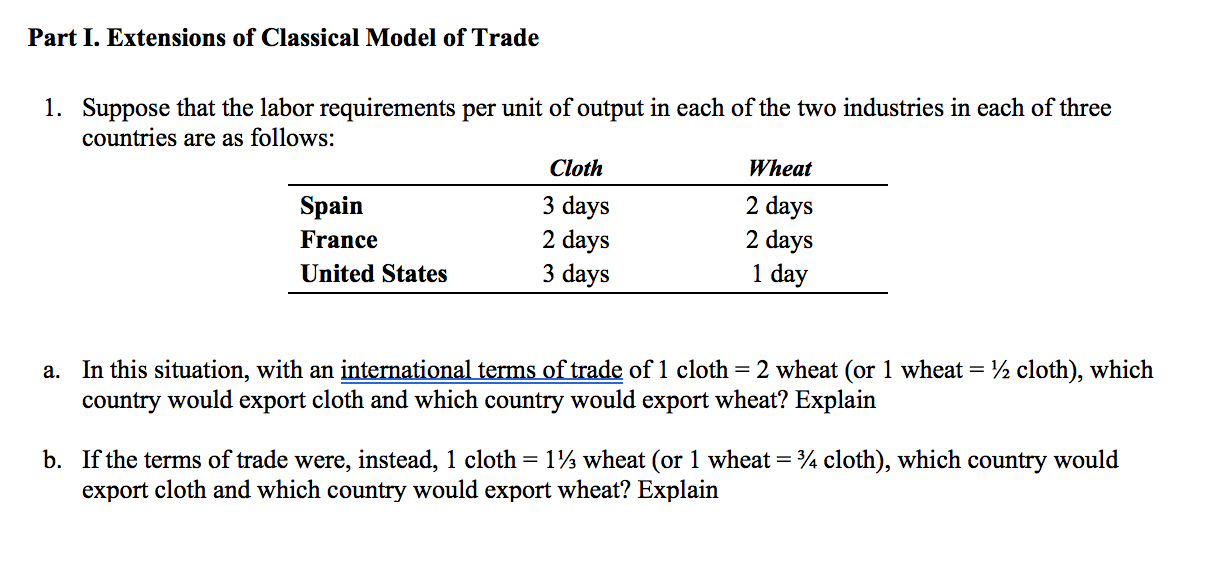
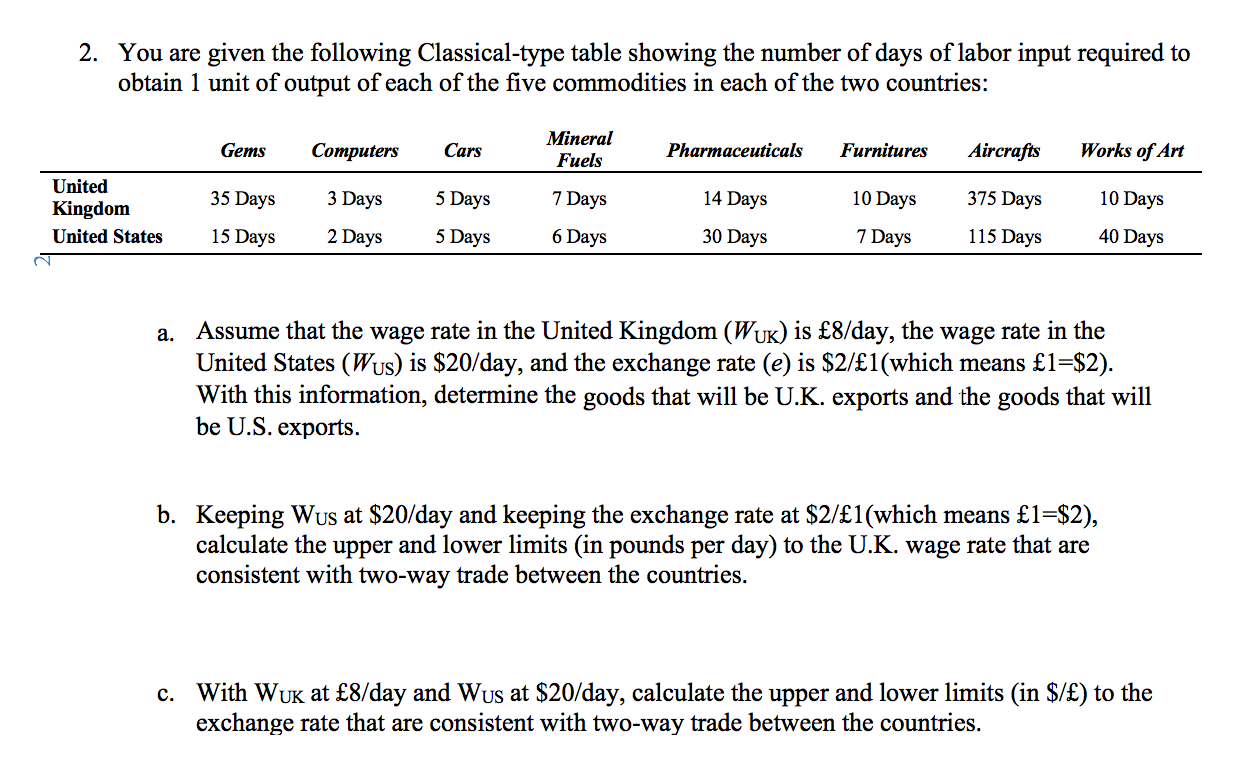
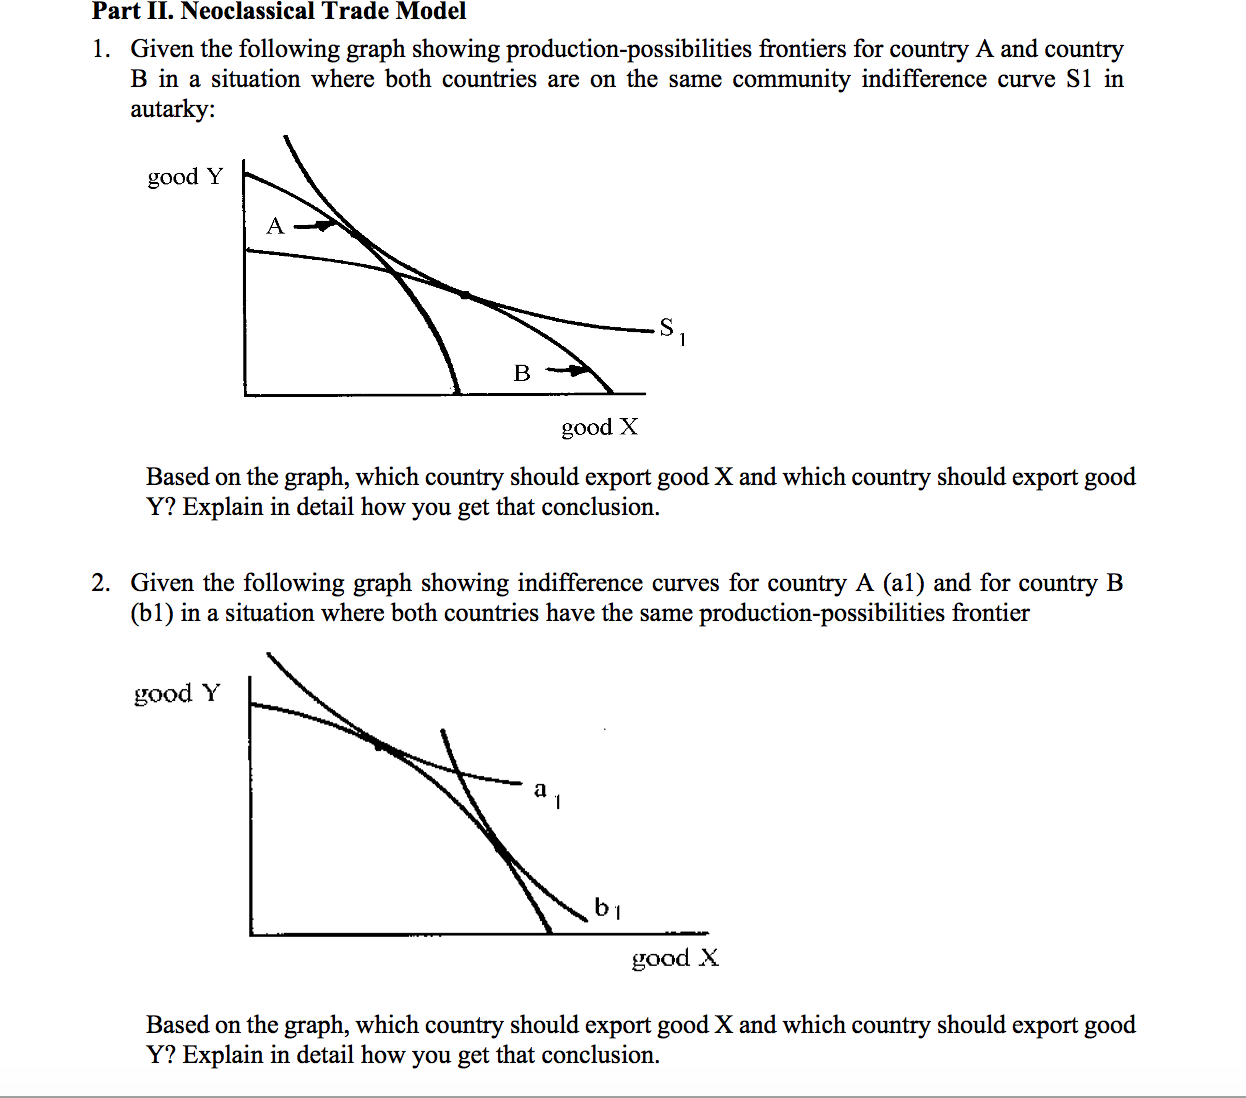
Part 1. Extensions of Classical Model of Trade 1. Suppose that the labor requirements per unit of output in each of the two industries in each of three countries are as follows: Cloth Wheat Spain 3 days 2 days France 2 days 2 days United States 3 days 1 day a. In this situation, with an jnIemagnaljezmioLtmde of 1 cloth = 2 wheat (or 1 wheat = 1/2 cloth), which country would export cloth and which country would export wheat? Explain b. If the terms of trade were, instead, 1 cloth = 11/3 wheat (or 1 wheat = 3/: cloth), which country would export cloth and which country would export wheat? Explain 2. You are given the following Classical-type table showing the number of days of labor input required to obtain 1 unit of output of each of the ve commodities in each of the two countries: Gems Computers Cars \"g\"! Pammuma Furnitures Ali-crafts Works ofAr: United I? don] 35 Days 3 Days 5 Days 7 Days 14 Days 10 Days 375 Days 10 Days United States 15 Days 2 Days 5 Days 6 Days 30 Days 7 Days 115 Days 40 Days a. Assume that the wage rate in the United Kingdom (WUK) is 8fday, the wage rate in the United States (Wug) is $20/day, and the exchange rate (2) is $2f1(which means 1=$2). With this information, determine the goods that will be U.K. exports and the goods that will be US. exports. b. Keeping Wus at $20/day and keeping the exchange rate at $2/1(which means 1=$2), calculate the upper and lower limits (in pounds per day) to the UK. wage rate that are consistent with twoway trade between the countries. 0. With WUK at 8/day and Wus at $20fday, calculate the upper and lower limits (in $/) to the exchange rate that are consistent with two-way trade between the countries. Part II. Neoclassical Trade Model 1. Given the following graph showing production-possibilities frontiers for country A and country B in a situation where both countries are on the same community indifference curve 31 in autarky: good Y good X Based on the graph, which country should export good X and which country should export good Y? Explain in detail how you get that conclusion. 2. Given the following graph showing indi'erence curves for country A (a1) and for country B 031) in a situation where both countries have the same productionpossibilities frontier good X. Based on the graph, which country should export good X and which country should export good Y? Explain in detail how you get that conclusion. Part 1]]. Offer Curve 1. Suppose that country A increases its willingness to trade, what can he said about the resulting impact on the terms of trade and on the volume of trade for country A? Assume import is price elastic. Use the graph of offer curve to illustrate your answer. 2. Suppose that country B impose a tariff on its imported product, what is the impact on the terms of trade and volume of trade for country A and country B? Use the graph of offer curve to illustrate your


