

Question
PART 1: FIND THIS RATIOS Asset utilization, or turnover, ratios 1. Inventory turnover = Cost of goods sold/Inventory 2. Days sales in inventory = 365
PART 1: FIND THIS RATIOS
Asset utilization, or turnover, ratios 1. Inventory turnover = Cost of goods sold/Inventory 2. Days sales in inventory = 365 days/Inventory turnover 3. Receivable turnover = Sales/Accounts receivable 4. Total asset turnover = Sales/Total Assets 5. Capital intensity = Total assets/sales
Profitability ratios 1. Profit margin = Net income/sales 2. Return on Assets (ROA) = Net income/Total assets 3. Return on Equity (ROE) = Net income/Total equity
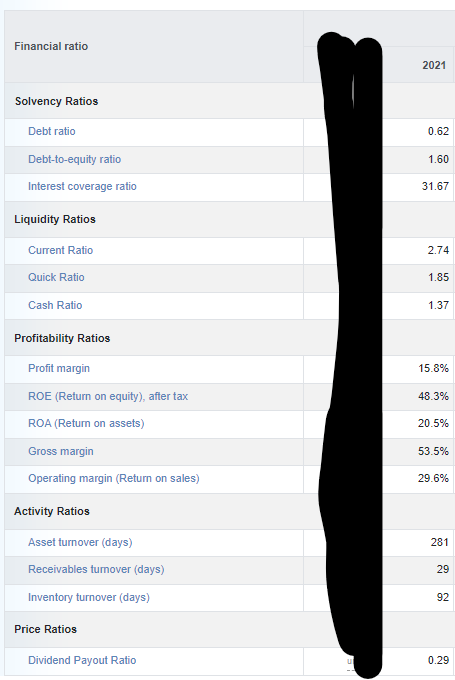
PART B. Comment on the firms ratios relative to the industry averages of 2021
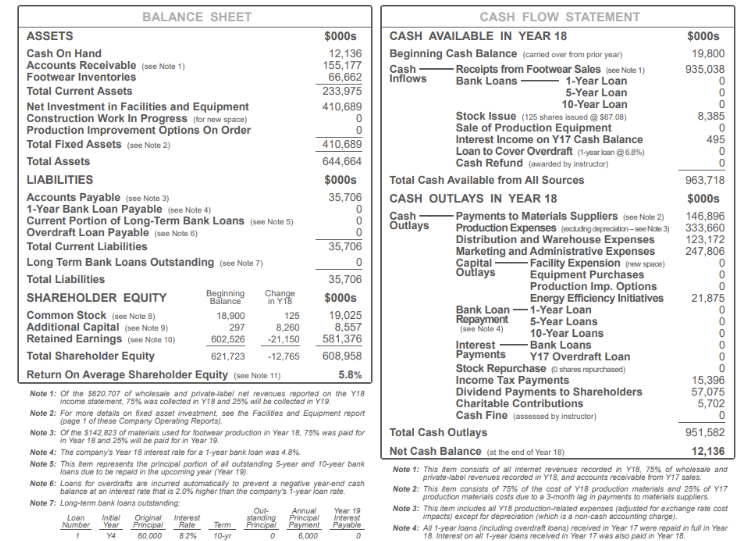
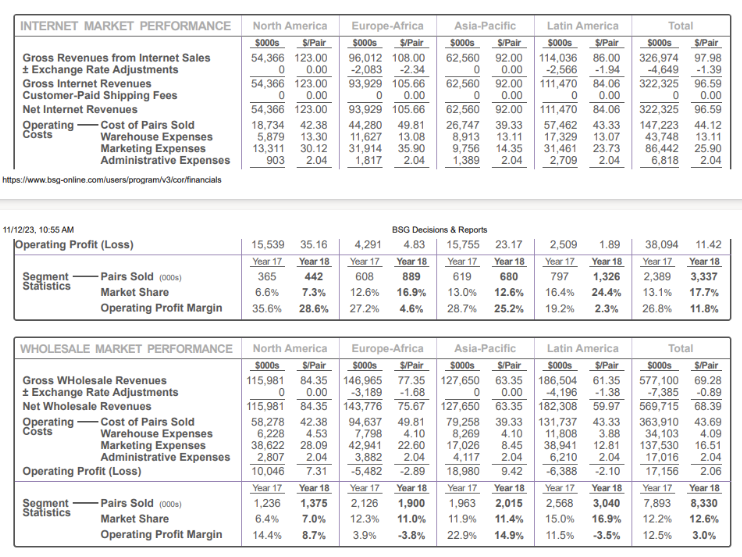
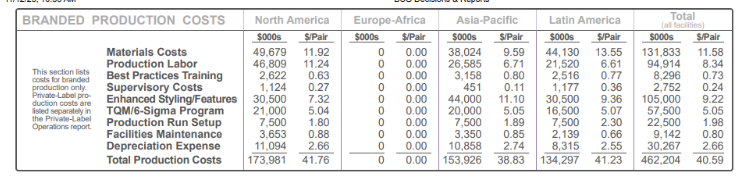
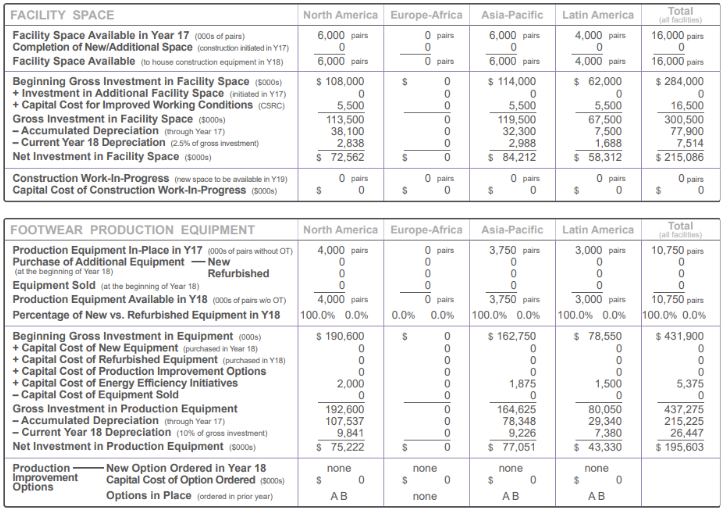
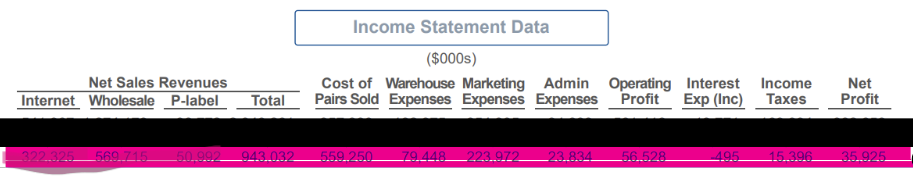
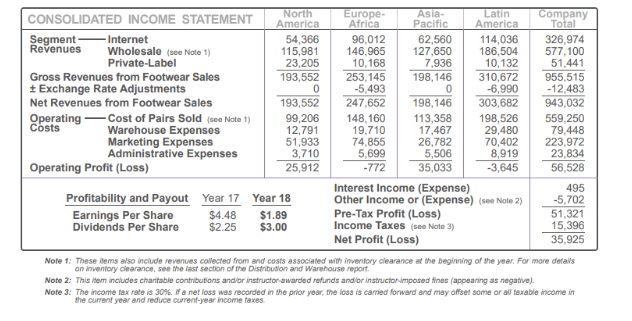
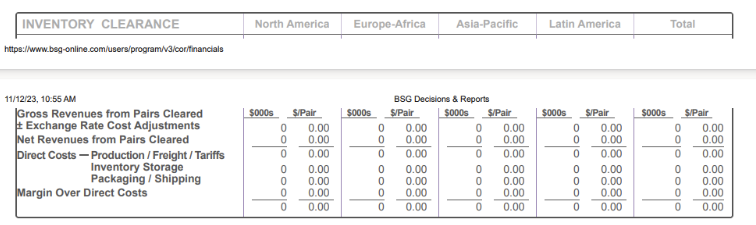
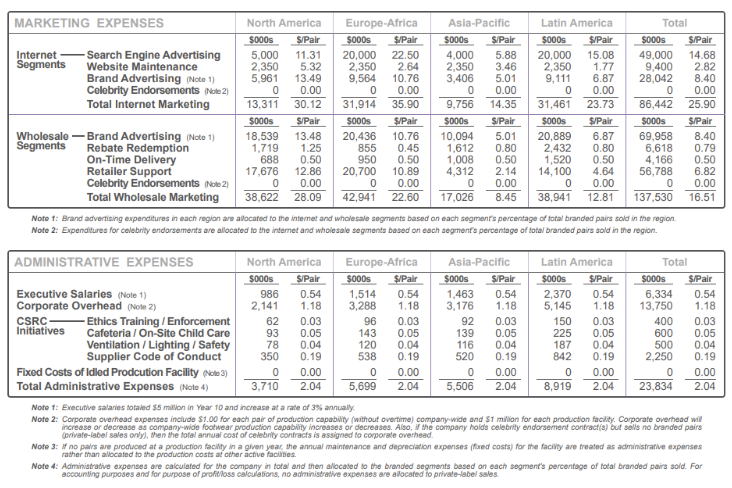
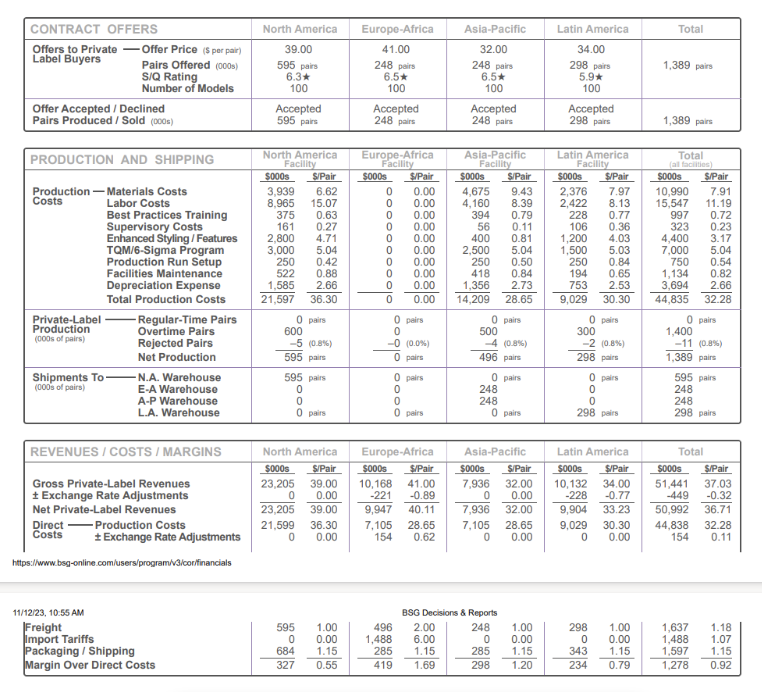
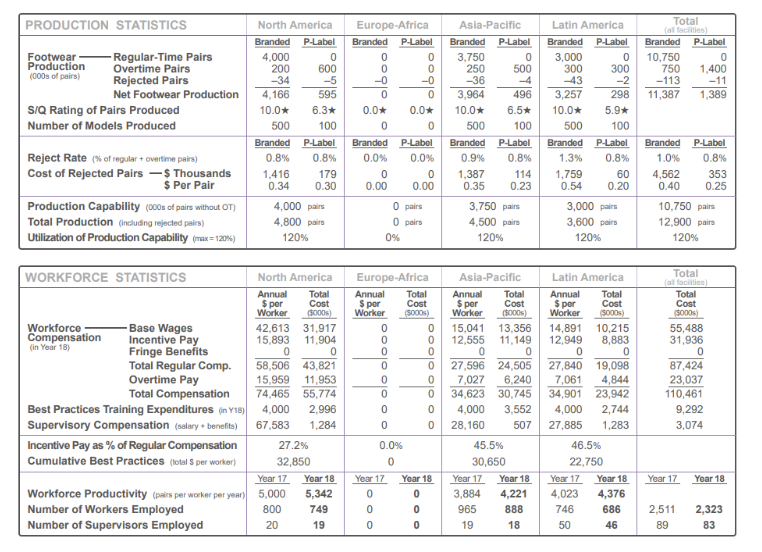
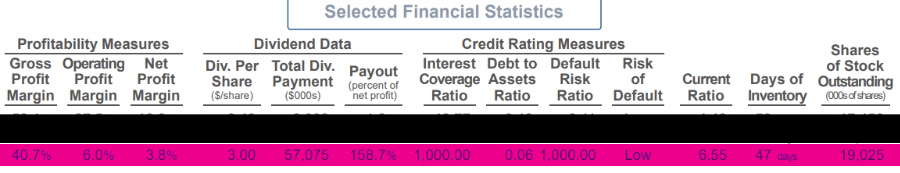
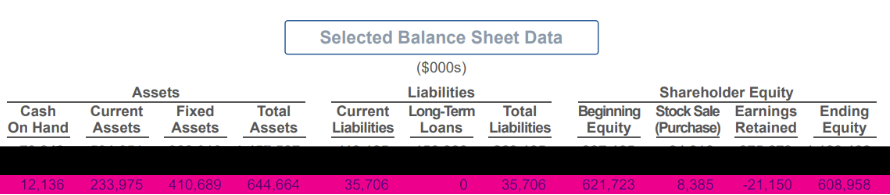
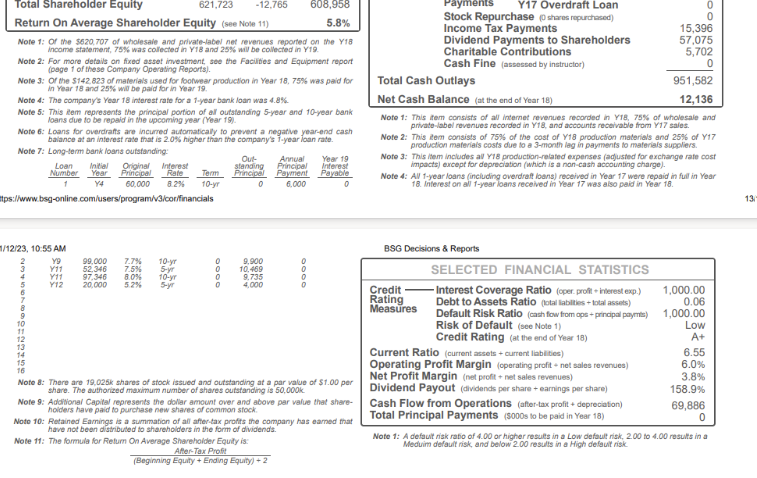
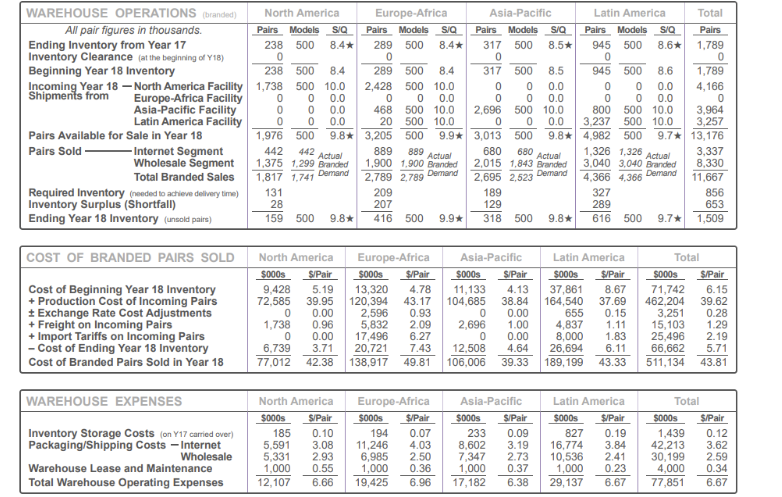
 Note 1: Of the $520,707 of wholesale and private-label net revenues reported on the Y18 income statement, 75% was collected in V18 and 25% wil be collected in Y19. Note 2: For more details on fixed asset imvestment, stee the Facilites and Equipment raport (page 1 of these Company Operating Reports). Note 3: Of the \$142,823 of materials used for footwear production in Vear 18, 75\% was paid for in Year 18 and 25% wit be pard for in Year 19. Note 4: The company's Year 18 interest rate for a 1-year bank loan was 4.8\%. Note 5: This Eem represents the principal portion of all outstanding 5-yoar and 10-year bank loans dive to be repaid in the upcoming year (Year 19). Noto 6: Loans for overdrafts are incurred automaticaly to provent a nogative year-end cash balance at an inferest rade that is 2.0% higher than the company's f-your loan rate. Note 7: Long-term bank loans outstanding: production materiais costs due to a 3-month lag in payments to materiais supplievs. Noto 3: This item includes all Y78 production-rolated expenses fadfusted for exehange rate cost impacts) except for doprociation (which is a non-cash accounting charge). Note 4: AVI 1-year loans (including overdraft loans) received in Yoar 17 wore repaid in full in Year 18. Interest on all 1 -year loans recelved in Year 17 was also paid in Year 18. \begin{tabular}{|c|c|c|c|c|c|c|c|c|c|c|} \hline \multirow[t]{2}{*}{ INTERNET MARKET PERFORMANCE } & \multicolumn{2}{|c|}{ North America } & \multicolumn{2}{|c|}{ Europe-Africa } & \multicolumn{2}{|c|}{ Asia-Pacific } & \multicolumn{2}{|c|}{ Latin America } & \multicolumn{2}{|c|}{ Total } \\ \hline & $000s & S/Pair & $000s & \$.Pair & $000s & S:Pair & & S/Pair & 5000s & S/Pair \\ \hline \begin{tabular}{l} Gross Revenues from Internet Sales \\ \pm Exchange Rate Adjustments \end{tabular} & \begin{tabular}{r} 54,366 \\ 0 \end{tabular} & \begin{tabular}{r} 123.00 \\ 0.00 \end{tabular} & \begin{tabular}{l} 96,012 \\ 2,083 \end{tabular} & \begin{tabular}{r} 108.00 \\ -2.34 \end{tabular} & \begin{tabular}{r} 62,560 \\ 0 \end{tabular} & \begin{aligned} 92.00 \\ 0.00\end{aligned} & \begin{tabular}{r} 114,036 \\ 2,566 \end{tabular} & \begin{tabular}{l} 86.00 \\ -1.94 \end{tabular} & \begin{tabular}{r} 326,974 \\ 4,649 \end{tabular} & \begin{tabular}{l} 97.98 \\ -1.39 \end{tabular} \\ \hline \begin{tabular}{l} Gross Internet Revenues \\ Customer-Paid Shipping Fees \end{tabular} & \begin{tabular}{r} 54,366 \\ 0 \\ \end{tabular} & \begin{tabular}{r} 123.00 \\ 0.00 \\ \end{tabular} & \begin{tabular}{r} 93,929 \\ 0 \\ \end{tabular} & \begin{tabular}{r} 105.66 \\ 0.00 \\ \end{tabular} & \begin{tabular}{r} 62,560 \\ 0 \\ \end{tabular} & \begin{tabular}{r} 92.00 \\ 0.00 \\ \end{tabular} & \begin{tabular}{r} 111,470 \\ 0 \\ \end{tabular} & \begin{tabular}{r} 84.06 \\ 0.00 \\ \end{tabular} & \begin{tabular}{r} 322,325 \\ 0 \\ \end{tabular} & \begin{tabular}{r} 96.59 \\ 0.00 \\ \end{tabular} \\ \hline Net Internet Revenues & 54,366 & 123.00 & 93,929 & 105.66 & 62,560 & 92.00 & 111,470 & 84.06 & 322,325 & 96.59 \\ \hline \begin{tabular}{cl} Operating - & Cost of Pairs Sold \\ Costs & Warehouse Expenses \\ & Marketing Expenses \\ & Administrative Expenses \end{tabular} & \begin{tabular}{r} 18,734 \\ 5,879 \\ 13,311 \\ 903 \end{tabular} & \begin{tabular}{r} 42.38 \\ 13.30 \\ 30.12 \\ 2.04 \end{tabular} & \begin{tabular}{r} 44,280 \\ 11,627 \\ 31,914 \\ 1,817 \end{tabular} & \begin{tabular}{r} 49.81 \\ 13.08 \\ 35.90 \\ 2.04 \end{tabular} & \begin{tabular}{r} 26,747 \\ 8,913 \\ 9,756 \\ 1,389 \end{tabular} & \begin{tabular}{r} 39.33 \\ 13.11 \\ 14.35 \\ 2.04 \end{tabular} & \begin{tabular}{r} 57,462 \\ 17,329 \\ 31,461 \\ 2,709 \end{tabular} & \begin{tabular}{r} 43.33 \\ 13.07 \\ 23.73 \\ 2.04 \\ \end{tabular} & \begin{tabular}{r} 147,223 \\ 43,748 \\ 86,442 \\ 6,818 \end{tabular} & \begin{tabular}{r} 44.12 \\ 13.11 \\ 25.90 \\ 2.04 \end{tabular} \\ \hline \end{tabular} https://www.bsg-online.com/users/program/V3/confinancials 11/12/23, 10:55 AM \begin{tabular}{|c|c|c|c|c|c|c|c|c|c|c|c|} \hline & & \multicolumn{8}{|c|}{ BSG Decisions \& Reports } & \multirow[b]{2}{*}{38,094} & \multirow[b]{2}{*}{11.42} \\ \hline \multicolumn{2}{|c|}{ Operating Profit (Loss) } & 15,539 & 35.16 & 4,291 & 4.83 & 15,755 & 23.17 & 2,509 & 1.89 & & \\ \hline \multirow{3}{*}{\begin{tabular}{l} Segment \\ Statistics \end{tabular}} & -Pairs & 365Year17 & 442Year18 & 608Year17 & 889Year18 & 619Year17 & 680Year18 & 797Year17 & 1,326Year18 & 2389Year17 & 3,337Year18 \\ \hline & Market Share & 6.6% & 7.3% & 12.6% & 16.9% & 13.0% & 12.6% & 16.4% & 24.4% & 13.1% & 17.7% \\ \hline & Operating Profit Margin & 35.6% & 28.6% & 27.2% & 4.6% & 28.7% & 25.2% & 19.2% & 2.3% & 26.8% & 11.8% \\ \hline \end{tabular} \begin{tabular}{|c|c|c|c|c|c|c|} \hline FACILITY SPACE & North America & Europ & e-Africa & Asia-Pacific & Latin America & \begin{tabular}{l} Total \\ (all faclities) \end{tabular} \\ \hline \begin{tabular}{l} Facility Space Avallable in Year 17 (c00s of pairs) \\ Completion of New/Additional Space (construdion naded in Y17) \\ Facility Space Available (to house construction equipment in Y18) \end{tabular} & \begin{tabular}{l} 6,000 pairs \\ 6,0000 pairs \end{tabular} & & \begin{tabular}{l} 0 pairs \\ 0 \\ 0 \end{tabular} & \begin{tabular}{l} 6,000 pairs \\ 6,0000 pairs \end{tabular} & \begin{tabular}{l} 4,000 pairs \\ 4,0000 pairs \end{tabular} & \begin{tabular}{l} 16,000 pairs \\ 16,0000pairs \end{tabular} \\ \hline \begin{tabular}{l} Beginning Gross Investment in Facility Space (5000s) \\ + Investment in Additional Facility Space (inilised in Y17) \\ + Capital Cost for Improved Working Conditions (CSRC) \\ Gross Investment in Facility Space (\$\$000s) \\ -Accumulated Depreciation (through Year 17) \\ - Current Year 18 Depreciation (2.5\% of gross investment) \\ Net Investment in Facility Space (\$000s) \end{tabular} & \begin{tabular}{r} $108,000 \\ 0 \\ 5,500 \\ 113,500 \\ 38,100 \\ 2,838 \\ $72,562 \end{tabular} & $ & \begin{tabular}{l} 0 \\ 0 \\ 0 \\ 0 \\ 0 \\ 0 \\ 0 \end{tabular} & \begin{tabular}{r} $114,000 \\ 0 \\ 5,500 \\ 119,500 \\ 32,300 \\ 2,988 \\ $84,212 \end{tabular} & \begin{tabular}{r} $2,000 \\ 0 \\ 5,500 \\ 67,500 \\ 7,500 \\ 1,688 \\ $58,312 \end{tabular} & \begin{tabular}{r} $284,000 \\ 0 \\ 16,500 \\ 300,500 \\ 77,900 \\ 7,514 \\ $215,086 \end{tabular} \\ \hline \begin{tabular}{l} Cons \\ Capit \end{tabular} & \begin{tabular}{c} 0 pairs \\ 0 \\ 0 \end{tabular} & s & \begin{tabular}{c} 0 pairs \\ 0 \end{tabular} & \begin{tabular}{c} 0 pairs \\ 0 \end{tabular} & \begin{tabular}{c} 0 pairs \\ 0 \end{tabular} & \begin{tabular}{r} 0 pairs \\ 0 \end{tabular} \\ \hline FOOTWEAR PRODUCTION EQUIPMENT & North America & Europ & e-Africa & Asia-Pacific & Latin America & \begin{tabular}{c} Total \\ (at faclities) \end{tabular} \\ \hline \begin{tabular}{l} Production Equipment In-Place in Y17 \\ Purchase of Additional Equipment - New pairs without OT) \\ (at the beginning of Year 18) \\ Equipment Sold (at the beginning of Year 18) \\ Production Equipment Available in Y18 (000s of pairs wo OT) \\ Percentage of New vs. Refurbished Equipment in Y18 \end{tabular} & \begin{tabular}{c} 4,000 pairs \\ 0 \\ 0 \\ 0 \\ 4,000 pairs \\ 100.0%0.0% \end{tabular} & 0.0% & \begin{tabular}{l} 0 pairs \\ 0 \\ 0 \\ 0 \\ 0 \\ 0.0% \end{tabular} & \begin{tabular}{r} 3,750 pairs \\ 0 \\ 0 \\ 0 \\ 3,750 pairs \\ 100.0%0.0% \end{tabular} & \begin{tabular}{r} 3,000 pairs \\ 0 \\ 0 \\ 0 \\ 3,000 \\ 100.0%0.0% \end{tabular} & \begin{tabular}{c} 10,750 pairs \\ 0 \\ 0 \\ 0 \\ 10,750 pairs \\ 100.0%0.0% \end{tabular} \\ \hline \begin{tabular}{l} Beginning Gross Investment in Equipment (000s) \\ + Capital Cost of New Equipment (purchased in Year 18) \\ + Capital Cost of Refurbished Equipment (purchased in Y18) \\ + Capital Cost of Production Improvement Options \\ + Capital Cost of Energy Efficiency Initiatives \\ - Capital Cost of Equipment Sold \\ Gross Investment in Production Equipment \\ - Accumulated Depreciation (through Yoar 17) \\ - Current Year 18 Depreciation (10\% of gross imestment) \\ Net Investment in Production Equipment (\$000s) \end{tabular} & \begin{tabular}{r} $190,600 \\ 0 \\ 0 \\ 0 \\ 2,000 \\ 0 \\ 192,600 \\ 107,537 \\ 9,841 \\ $75,222 \end{tabular} & $ & \begin{tabular}{l} 0 \\ 0 \\ 0 \\ 0 \\ 0 \\ 0 \\ 0 \\ 0 \\ 0 \\ 0 \end{tabular} & \begin{tabular}{r} $162,750 \\ 0 \\ 0 \\ 0 \\ 1,875 \\ 0 \\ 164,625 \\ 78,348 \\ 9,226 \\ $77,051 \end{tabular} & \begin{tabular}{r} $78,550 \\ 0 \\ 0 \\ 0 \\ 1,500 \\ 0 \\ 80,050 \\ 29,340 \\ 7,380 \\ $43,330 \end{tabular} & \begin{tabular}{r} $431,900 \\ 0 \\ 0 \\ 0 \\ 5,375 \\ 0 \\ 437,275 \\ 215,225 \\ 26,447 \\ $195,603 \end{tabular} \\ \hline \begin{tabular}{ll} Production & New Option Ordered in Year 18 \\ Improvement & Capital Cost of Option Ordered (\$000s) \\ Options & Options in Place (oeddered in prior year) \end{tabular} & sABnone0 & s & \begin{tabular}{l} one 0 \\ one \end{tabular} & $ABnone0 & $ABnone0 & \\ \hline \end{tabular} Note 1: These flems also include revenues collected from and costs associated with imentory clearance at the beginning of the year. For more details on imentory clearance, see the last section of the Distribution and Warehouse report. Note 2: This item includes chantabie contributions andior instructor-awarded refunds andior instructorimposed fines (appearing as negathe). Note 3: The income fax rate is 30%. If a net loss was recorded in the prior year, the loss is camied fonvard and may offset some or all taxable income in the current year and redice current-year income taxes. \begin{tabular}{|l|l|l|l|l|} \hline INVENTORY CLEARANCE & North America & Europe-Africa & Asia-Pacific & Latin America \\ \hline \end{tabular} https://www.beg-online-com/users/programiv3/coritinancials 11/12/23,10:55AM Gross Revenues from Pairs Cleared E Exchange Rate Cost Adjustments Net Revenues from Pairs Cleared Direct Costs - Production / Freight / Tariffs Inventory Storage Packaging / Shipping Margin Over Direct Costs BSG Decisions \& Reports Note 1: Executive salaries totaled $5 malion in Year 10 and increase at a rate of 3% annually. Note 2: Corporate overhead expenses include $1.00 for each pair of production capability (without overtime) company-wide and $1 milion for each production faclity. Corporate overhead will increase or decrease as company-wide footwear production capability increases or decreases. Also, If the company halds celabrity endorsement contract(s) but sells no branded pairs covivale-label sales only), then the total annual cost of celebrity contracts is assigned to copporate overhead. Note 3: If no pars are produced at a production facilify in a given year, the annual mainfenance and depreciation expenses (ffred costs) for the facily are treated as administrative expenses rather than allocated to the production costs at other active facilines. Note 4: Administrative expenses are calculafed for the company in total and then allocated to the branded segments based an each segment's percentage of total branded pairs sold. For accounting purposes and for purpose of profithass calculations, no administrative expenses are allocafed to private-label sales. \begin{tabular}{|c|c|c|c|c|c|c|c|c|c|c|} \hline \multirow[t]{2}{*}{ REVENUES / COSTS / MARGINS } & \multicolumn{2}{|c|}{ North America } & \multicolumn{2}{|c|}{ Europe-Africa } & \multicolumn{2}{|c|}{ Asia-Pacific } & \multicolumn{2}{|c|}{ Latin America } & \multicolumn{2}{|c|}{ Total } \\ \hline & $000s & S/Pair & $000s & $/Pair & $000s & S/Pair & $000s & \$/Pair & 5000s & \$:Pair \\ \hline \begin{tabular}{l} Gross Private-Label Revenues \\ \pm Exchange Rate Adjustments \end{tabular} & \begin{tabular}{r} 23,205 \\ 0 \\ \end{tabular} & \begin{tabular}{r} 39.00 \\ 0.00 \\ \end{tabular} & \begin{tabular}{r} 10,168 \\ -221 \\ \end{tabular} & \begin{tabular}{r} 41.00 \\ -0.89 \\ \end{tabular} & \begin{tabular}{r} 7,936 \\ 0 \\ \end{tabular} & \begin{tabular}{r} 32.00 \\ 0.00 \\ \end{tabular} & \begin{tabular}{r} 10,132 \\ -228 \\ \end{tabular} & \begin{tabular}{r} 34.00 \\ -0.77 \\ \end{tabular} & \begin{tabular}{r} 51,441 \\ -449 \\ \end{tabular} & \begin{aligned} 37.03 \\ -0.32 \\ \end{aligned} \\ \hline Net Private-Label Revenues & 23,205 & 39.00 & 9,947 & 40.11 & 7,936 & 32.00 & 9,904 & 33.23 & 50,992 & 36.71 \\ \hline \begin{tabular}{ll} Direct & Production Costs \\ Costs & \pm Exchange Rate Adjustments \end{tabular} & \begin{tabular}{r} 21,599 \\ 0 \end{tabular} & \begin{tabular}{r} 36.30 \\ 0.00 \end{tabular} & \begin{tabular}{r} 7,105 \\ 154 \end{tabular} & \begin{tabular}{r} 28.65 \\ 0.62 \end{tabular} & \begin{tabular}{r} 7,105 \\ 0 \end{tabular} & \begin{tabular}{r} 28.65 \\ 0.00 \end{tabular} & \begin{tabular}{r} 9,029 \\ 0 \end{tabular} & \begin{tabular}{r} 30.30 \\ 0.00 \end{tabular} & \begin{tabular}{r} 44,838 \\ 154 \end{tabular} & \begin{tabular}{r} 32.28 \\ 0.11 \end{tabular} \\ \hline \end{tabular} https://www.bsg-online_com/users/program/V3/confinancials 11/12/23,10:55AM Freight Import Tariffs Packaging / Shipping Margin Over Direct Costs BSG Decisions \& Reports \begin{tabular}{|c|c|c|c|c|c|c|c|} \hline & & & & & & & \\ \hline 496 & 2.00 & 248 & 1.00 & 298 & 1.00 & 1,637 & 1.18 \\ \hline 1,488 & 6.00 & 0 & 0.00 & 0 & 0.00 & 1,488 & 1.07 \\ \hline 285 & 1.15 & 285 & 1.15 & 343 & 1.15 & 1,597 & 1.15 \\ \hline419 & 1.69 & 298 & 1.20 & 234 & 0.79 & 1,278 & 0.92 \\ \hline \end{tabular} \begin{tabular}{|c|c|c|c|c|c|c|c|c|c|c|} \hline PRODUCTION STATISTICS & \multicolumn{2}{|c|}{ North America } & \multicolumn{2}{|c|}{ Europe-Africa } & \multicolumn{2}{|c|}{ Asia-Pacific } & \multicolumn{2}{|c|}{ Latin America } & \multicolumn{2}{|c|}{\begin{tabular}{c} Total \\ (al facities) \end{tabular}} \\ \hline \multirow{7}{*}{\begin{tabular}{l} Footwear \\ Production \\ (000s of pairs) \end{tabular}} & Branded & P-Label & Branded & P-Label & Branded & P-Label & Branded & P-Label & Branded & P-Label \\ \hline & 4,000 & 0 & 0 & 0 & 3,750 & 0 & 3,000 & 0 & 10,750 & \\ \hline & 200 & 600 & 0 & 0 & 250 & 500 & 300 & 300 & 750 & 1,400 \\ \hline & -34 & -5 & -0 & -0 & -36 & -4 & -43 & -2 & & -11 \\ \hline & 4,166 & 595 & 0 & 0 & 3,964 & 496 & 3,257 & 298 & 11,387 & 1,389 \\ \hline & 10.0 & 6.3 & 0.0 & 0.0 & 10.0 & 6.5 & 10.0 & 5.9 & & \\ \hline & 500 & 100 & 0 & 0 & 500 & 100 & 500 & 100 & & \\ \hline \multirow{3}{*}{\begin{tabular}{l} Reject Rate (\% of regular + overtime pairs) \\ Cost of Rejected Pairs -\$ Thousands \\ \$ Per Pair \end{tabular}} & Brandod & P-Label & Brandod & P-Labol & Brandod & P-Label & Branded & P-Labol & Brandod & P-Labol \\ \hline & 0.8% & 0.8% & 0.0% & 0.0% & 0.9% & 0.8% & 1.3% & 0.8% & 1.0% & 0.8% \\ \hline & \begin{tabular}{r} 1,416 \\ 0.34 \end{tabular} & \begin{tabular}{r} 179 \\ 0.30 \end{tabular} & \begin{tabular}{r} 0 \\ 0.00 \end{tabular} & \begin{tabular}{r} 0 \\ 0.00 \end{tabular} & \begin{tabular}{r} 1,387 \\ 0.35 \end{tabular} & \begin{tabular}{r} 114 \\ 0.23 \end{tabular} & \begin{tabular}{r} 1,759 \\ 0.54 \end{tabular} & \begin{tabular}{r} 60 \\ 0.20 \end{tabular} & \begin{tabular}{r} 4,562 \\ 0.40 \end{tabular} & \begin{tabular}{r} 353 \\ 0.25 \end{tabular} \\ \hline \multirow{3}{*}{\begin{tabular}{l} Production Capability ( 000s of pairs without OT) \\ Total Production (including rejected pairs) \\ Utilization of Production Capability (max =120%) \end{tabular}} & \multirow{3}{*}{\multicolumn{2}{|c|}{\begin{tabular}{l} 4,000 pairs \\ 4,800 pairs \\ 120% \end{tabular}}} & \multirow{3}{*}{\multicolumn{2}{|c|}{\begin{tabular}{l} 0 pairs \\ 0 pairs \\ 0% \end{tabular}}} & \multirow{3}{*}{\multicolumn{2}{|c|}{\begin{tabular}{l} 3,750 pairs \\ 4,500 pairs \\ 120% \end{tabular}}} & \multirow{3}{*}{\multicolumn{2}{|c|}{\begin{tabular}{l} 3,000 pairs \\ 3,600 pairs \\ 120% \end{tabular}}} & \multirow{3}{*}{\multicolumn{2}{|c|}{\begin{tabular}{c} 10,750 pairs \\ 12,900 pairs \\ 120% \end{tabular}}} \\ \hline & & & & & & & & & & \\ \hline & & & & & & & & & & \\ \hline \end{tabular} \begin{tabular}{|c|c|c|c|c|c|c|c|c|c|c|c|} \hline \multicolumn{2}{|c|}{ WORKFORCE STATISTICS } & \multicolumn{2}{|c|}{ North America } & \multicolumn{2}{|c|}{ Europe-Africa } & \multicolumn{2}{|c|}{ Asla-Pacific } & \multicolumn{2}{|c|}{ Latin America } & \multicolumn{2}{|c|}{\begin{tabular}{c} Total \\ (al facities) \end{tabular}} \\ \hline \multirow{7}{*}{\begin{tabular}{l} Workforce \\ Compensation \\ (in Yoar 18) \end{tabular}} & \multirow{4}{*}{\begin{tabular}{l} Base Wages \\ Incentive Pay \\ Fringe Benefits \end{tabular}} & \begin{tabular}{l} Annual \\ $ per \\ Worker \\ \end{tabular} & \begin{tabular}{l} Total \\ Cost \\ (\$ooos) \\ \end{tabular} & \begin{tabular}{l} Annual \\ \$por \\ Worker \\ \end{tabular} & \begin{tabular}{c} Total \\ Cost \\ (30005) \\ \end{tabular} & \begin{tabular}{l} Annual \\ \$por \\ Worker \\ \end{tabular} & \begin{tabular}{l} Total \\ Cost \\ (\$oo0s) \\ \end{tabular} & \begin{tabular}{l} Annual \\ \$por \\ Worker \\ \end{tabular} & \begin{tabular}{l} Total \\ Cost \\ ($000s) \\ \end{tabular} & \\ \hline & & 42,613 & 31,917 & 0 & 0 & 15,041 & 13,356 & 14,891 & 10,215 & \multirow{3}{*}{\multicolumn{2}{|c|}{\begin{tabular}{r} 55,488 \\ 31,936 \\ 0 \end{tabular}}} \\ \hline & & 15,893 & 11,904 & 0 & 0 & 12,555 & 11,149 & 12,949 & 8,883 & & \\ \hline & & & & 0 & 0 & & & 0 & & & \\ \hline & Total Regular Comp. & 58,506 & 43,821 & 0 & 0 & 27,596 & 24,505 & 27,840 & 19,098 & \multicolumn{2}{|c|}{87,4240} \\ \hline & Overtime Pay & 15,959 & 11,953 & 0 & 0 & 7,027 & 6,240 & 7,061 & 4,844 & \multicolumn{2}{|c|}{23,037} \\ \hline & Total Compensation & 74,465 & 55,774 & 0 & 0 & 34,623 & 30,745 & 34,901 & 23,942 & \multicolumn{2}{|c|}{110,461} \\ \hline \multirow{2}{*}{\multicolumn{2}{|c|}{\begin{tabular}{l} Best Practices Training Expenditures (in Y18) \\ Supervisory Compensation (salary + benefits) \end{tabular}}} & 4,000 & 2,996 & 0 & 0 & 4,000 & 3,552 & 4,000 & 2,744 & & 292 \\ \hline & & 67,583 & 1,284 & 0 & 0 & 28,160 & 507 & 27,885 & 1,283 & & 074 \\ \hline \multirow{2}{*}{\multicolumn{2}{|c|}{\begin{tabular}{l} Incentive Pay as % of Regular Compensation \\ Cumulative Best Practices (total \$ per worker) \end{tabular}}} & \multirow{2}{*}{\multicolumn{2}{|c|}{\begin{tabular}{l} 27.2% \\ 32,850 \end{tabular}}} & \multirow{2}{*}{\multicolumn{2}{|c|}{\begin{tabular}{c} 0.0% \\ 0 \end{tabular}}} & \multirow{2}{*}{\multicolumn{2}{|c|}{\begin{tabular}{l} 45.5% \\ 30,650 \end{tabular}}} & \multirow{2}{*}{\multicolumn{2}{|c|}{\begin{tabular}{l} 46.5% \\ 22,750 \end{tabular}}} & & \\ \hline & & & & & & & & & & & \\ \hline \multirow{4}{*}{\multicolumn{2}{|c|}{\begin{tabular}{l} Workforce Productivity (pairs per woker per year) \\ Number of Workers Employed \\ Number of Supervisors Employed \end{tabular}}} & Year 17 & Yoar 18 & Year 17 & Yoar 18 & Year 17 & Yoar 18 & Year 17 & Yoar 18 & Year 17 & Yoar 18 \\ \hline & & 5,000 & 5,342 & 0 & 0 & 3,884 & 4,221 & 4,023 & 4,376 & & \\ \hline & & 800 & 749 & 0 & 0 & 965 & 888 & 746 & 686 & 2,511 & 2,323 \\ \hline & & 20 & 19 & 0 & 0 & 19 & 18 & 50 & 46 & 89 & 83 \\ \hline \end{tabular} \begin{tabular}{|c|c|c|c|c|c|c|c|c|c|c|c|c|} \hline \multirow{2}{*}{\multicolumn{3}{|c|}{ Profitability Measures }} & \multicolumn{6}{|c|}{ Selected Financial Statistics } & & \multirow[b]{3}{*}{\begin{tabular}{c} Current \\ Ratio \end{tabular}} & \multirow[b]{3}{*}{\begin{tabular}{l} Days of \\ Inventory \end{tabular}} & \multirow[b]{3}{*}{\begin{tabular}{c} Shares \\ of Stock \\ Outstanding \\ (000s of sheres) \end{tabular}} \\ \hline & & & \multicolumn{3}{|c|}{ Dividend Data } & \multicolumn{3}{|c|}{ Credit Rating Measures } & & & & \\ \hline \begin{tabular}{l} Gross \\ Profit \\ Margin \end{tabular} & \begin{tabular}{c} Operating \\ Profit \\ Margin \end{tabular} & \begin{tabular}{c} Net \\ Profit \\ Margin \end{tabular} & \begin{tabular}{c} Div. Per \\ Share \\ (\$/share) \end{tabular} & \begin{tabular}{l} Total Div. \\ Payment \\ ($000s) \end{tabular} & \begin{tabular}{l} Payout \\ (percent of \\ net profit) \end{tabular} & \begin{tabular}{c} Interest \\ Coverage \\ Ratio \end{tabular} & \begin{tabular}{l} Debt to \\ Assets \\ Ratio \end{tabular} & \begin{tabular}{c} Default \\ Risk \\ Ratio \end{tabular} & \begin{tabular}{c} Risk \\ of \\ Default \end{tabular} & & & \\ \hline \end{tabular} \begin{tabular}{|c|c|c|c|c|c|c|c|c|c|c|} \hline & & & & Selected & Balance S & heet Data & & & & \\ \hline & & & & & ($000s) & & & & & \\ \hline & & & & & Liabilities & & & Sharehold & Jer Equity & \\ \hline \begin{tabular}{c} Cash \\ On Hand \end{tabular} & \begin{tabular}{l} Current \\ Assets \end{tabular} & \begin{tabular}{c} Fixed \\ Assets \end{tabular} & \begin{tabular}{c} Total \\ Assets \end{tabular} & \begin{tabular}{c} Current \\ Liabilities \end{tabular} & \begin{tabular}{c} Long-Term \\ Loans \end{tabular} & \begin{tabular}{c} Total \\ Liabilities \end{tabular} & \begin{tabular}{l} Beginning \\ Equity \end{tabular} & \begin{tabular}{l} Stock Sale \\ (Purchase) \end{tabular} & \begin{tabular}{l} Earnings \\ Retained \end{tabular} & \begin{tabular}{c} Ending \\ Equity \end{tabular} \\ \hline \end{tabular} Note 1: of the \$520.707 of wholesale and private-label net revenues reported on the Y18 income statement, 75% was collected in Y18 and 25% will be collected in Y19 Note 2: For more details on fixed asset investment, see the Facilites and Equipment report (page 1 of these Company Operading Reports). Note 3: Of the \$142, 823 of materials used for foolwear production in Year 18, 75\% was paid for in Yoar 18 and 25% wil be paid for in Yoar 19. Note 4: The company's Year 18 interest rate for a 1-year bank loan was 4.8%. Note 5: This elem represents the principal portion of all outstending 5-yoar and 10-year bank loans due to be repald in the upcoming year (Yoar 19 ). Note 6: Loans for overdrafts are incurred automafically fo prevent a negative year-end cash balance at an infevest rade that is 2.0% higher than the company's t-yoar ioan rate. Note 7: Long-tem bank loans outstanding: tps:/hww bsg-online com/users/program/v3/corfinancials Note 1: This fem consists of all internet revenues recorded in YTB, 75% of wholesale and private-label revenues recorded in Y18, and actounts receivable from Y17 sales. Note 2: This Eem consists of 75% of the cost of Y18 production materials and 25% of Y+7 production materials costs due to a 3-month lag in payments to maferials suppliers. Note 3: This item includes all Yis production-related expenses (ad)usted for exchange rate cost impacts) except for depreciation (which is a non-cash accouning charge). Note 4: All t-year loans (including overdraft loans) recelved in Yoar 17 were repaid in fut in Year 18. Inflerest on all 1 -year loens recelved in Year 17 was also paid in Year 18. Note 8: There are 19,025k shares of stock issued and outstanding at a par value of $1.00 per share. The outhorized maximum number of shaves outstanding is 50,000k. Note 9: AddWonal Capital represents the dollar amount over and above par vafue that shareholders have paid to purchase new shaves of comman stock. Note 10: Retained Eamings is a summation of aff after-tax profits the company has eamed that have not been distribuded to shareholders in the form of dividends. Note 11: The formula for Retum On Average Shareholder Equity is: Afler-Tax Profit Note 1: A default risk rabio of 4.00 or higher results in a Low default risk, 2.00 to 4.00 results in a Meduim defautt nisk, and below 2.00 results in a High defaut risk. \begin{tabular}{|c|c|c|c|c|c|c|c|c|c|c|c|c|c|} \hline WAREHOUSE OPERATIONS & \multicolumn{3}{|c|}{ North America } & \multicolumn{3}{|c|}{ Europe-Africa } & \multicolumn{3}{|c|}{ Asia-Pacific } & \multicolumn{3}{|c|}{ Latin America } & Total \\ \hline All pair figures in thousands. & Pairs & Models & S/Q & Pairs & Modals & S/Q & Pairs & Models & S/Q & Pairs & Models & SIQ & Pairs \\ \hline \begin{tabular}{l} Ending Inventory from Year 17 \\ Inventory Clearance (at the beginning Y18) \end{tabular} & \begin{tabular}{r} 238 \\ 0 \\ \end{tabular} & 500 & 8.4 & \begin{tabular}{r} 289 \\ 0 \end{tabular} & 500 & 8.4 & \begin{tabular}{r} 317 \\ 0 \\ \end{tabular} & 500 & 8.5 & \begin{tabular}{r} 945 \\ 0 \end{tabular} & 500 & 8.6 & \begin{tabular}{r} 1,789 \\ 0 \end{tabular} \\ \hline Beginning Year 18 Inventory & 238 & 500 & 8.4 & 289 & 500 & 8.4 & 317 & 500 & 8.5 & 945 & 500 & 8.6 & 1,789 \\ \hline \begin{tabular}{lc} Incoming Year 18 - & North America Facility \\ Shipments from & Europe-Africa Facility \\ & Asia-Pacific Facility \\ & Latin America Facility \end{tabular} & \begin{tabular}{r} 1,738 \\ 0 \\ 0 \\ 0 \\ \end{tabular} & \begin{tabular}{r} 500 \\ 0 \\ 0 \\ 0 \\ \end{tabular} & \begin{tabular}{r} 10.0 \\ 0.0 \\ 0.0 \\ 0.0 \\ \end{tabular} & \begin{tabular}{r} 2,428 \\ 0 \\ 468 \\ 20 \\ \end{tabular} & \begin{tabular}{r} 500 \\ 0 \\ 500 \\ 500 \\ \end{tabular} & \begin{tabular}{r} 10.0 \\ 0.0 \\ 10.0 \\ 10.0 \end{tabular} & \begin{tabular}{r} 0 \\ 0 \\ 2,696 \\ 0 \\ \end{tabular} & \begin{tabular}{r} 0 \\ 0 \\ 500 \\ 0 \\ \end{tabular} & \begin{tabular}{r} 0.0 \\ 0.0 \\ 10.0 \\ 0.0 \\ \end{tabular} & \begin{tabular}{r} 0 \\ 0 \\ 800 \\ 3,237 \\ \end{tabular} & \begin{tabular}{r} 0 \\ 0 \\ 500 \\ 500 \\ \end{tabular} & \begin{tabular}{r} 0.0 \\ 0.0 \\ 10.0 \\ 10.0 \\ \end{tabular} & \begin{tabular}{r} 4,166 \\ 0 \\ 3,964 \\ 3,257 \\ \end{tabular} \\ \hline Pairs Available for Sale in Year 18 & 1,976 & 500 & 9.8 & 3,205 & 500 & 9.9 & 3,013 & 500 & 9.8 & 4,982 & 500 & 9.7 & 13,176 \\ \hline \begin{aligned} Pairs Sold - & Internet Segment \\ & Wholesale Segment \\ & Total Branded Sales \end{aligned} & \begin{tabular}{r} 442 \\ 1,375 \\ 1,817 \end{tabular} & \begin{tabular}{r} 442 \\ 1,299 \\ 1,741 \end{tabular} & \begin{tabular}{l} Actual \\ Branded \\ Demand \end{tabular} & \begin{tabular}{r} 889 \\ 1,900 \\ 2,789 \end{tabular} & \begin{tabular}{r} 889 \\ 2,7891,900 \end{tabular} & \begin{tabular}{l} Actual \\ Branded \\ Demand \end{tabular} & \begin{tabular}{r} 680 \\ 2,015 \\ 2,695 \end{tabular} & \begin{tabular}{r} 680 \\ 1,843 \\ 2,523 \end{tabular} & \begin{tabular}{l} Actual \\ Branded \\ Demand \end{tabular} & \begin{tabular}{l} 1,326 \\ 3,040 \\ 4,366 \end{tabular} & \begin{tabular}{l} 1,326 \\ 4,3663,040 \end{tabular} & \begin{tabular}{l} Actual \\ Branded \\ Demand \end{tabular} & \begin{tabular}{r} 3,337 \\ 8,330 \\ 11,667 \end{tabular} \\ \hline \begin{tabular}{l} Required Inventory (needed to achieve deltwery time) \\ Inventory Surplus (Shortfall) \end{tabular} & \begin{tabular}{r} 131 \\ 28 \\ 159 \end{tabular} & 500 & 9.8+ & \begin{tabular}{l} 209 \\ 207 \\ 416 \end{tabular} & 500 & 90 & \begin{tabular}{l} 189 \\ 129 \\ 318 \end{tabular} & 500 & 98 & \begin{tabular}{l} 327 \\ 289 \\ 616 \end{tabular} & 500 & 97 & \begin{tabular}{r} 856 \\ 653 \\ 1509 \end{tabular} \\ \hline \end{tabular} \begin{tabular}{|c|c|c|c|c|c|c|c|c|c|c|} \hline \multirow[t]{2}{*}{ COST OF BRANDED PAIRS SOLD } & \multicolumn{2}{|c|}{ North America } & \multicolumn{2}{|c|}{ Europe-Africa } & \multicolumn{2}{|c|}{ Asia-Pacific } & \multicolumn{2}{|c|}{ Latin America } & \multicolumn{2}{|c|}{ Total } \\ \hline & $000s & SPair & $000s & $/Pair & $000s & S/Pair & $000s & \$Pair & $000 s & \$/Pair \\ \hline Cost of Beginning Year 18 Inventory & 9,428 & 5.19 & 13,320 & 4.78 & 11,133 & 4.13 & 37,861 & 8.67 & 71,742 & 6.15 \\ \hline + Production Cost of Incoming Pairs & 72,585 & 39.95 & 120,394 & 43.17 & 104,685 & 38.84 & 164,540 & 37.69 & 462,204 & 39.62 \\ \hline \pm Exchange Rate Cost Adjustments & & 0.00 & 2,596 & 0.93 & & 0.00 & 655 & 0.15 & 3,251 & 0.28 \\ \hline + Freight on Incoming Pairs & 1,738 & 0.96 & 5,832 & 2.09 & 2,696 & 1.00 & 4,837 & 1.11 & 15,103 & 1.29 \\ \hline + Import Tariffs on Incoming Pairs & & 0.00 & 17,496 & 6.27 & 0 & 0.00 & 8,000 & 1.83 & 25,496 & 2.19 \\ \hline - Cost of Ending Year 18 Inventory & 6,739 & 3.71 & 20,721 & 7.43 & 12,508 & 4.64 & 26,694 & 6.11 & 66,662 & 5.71 \\ \hline Cost of Brandod Pairs Sold in Yoar 18 & 77,012 & 42.38 & 138,917 & 49.81 & 106,006 & 39.33 & 189,199 & 43.33 & 511,134 & 43.81 \\ \hline \end{tabular} \begin{tabular}{|c|c|c|c|c|c|c|c|c|c|c|} \hline WAREHOUSE EXPENSES & \multicolumn{2}{|c|}{ North America } & \multicolumn{2}{|c|}{ Europo-Africa } & \multicolumn{2}{|c|}{ Asla-Pacific } & \multicolumn{2}{|c|}{ Latin America } & \multicolumn{2}{|c|}{ Total } \\ \hline & $000s & \$/Pair & $000s & \$/Pair & $000s & \$/Pair & $000 s & \$/Pair & $000 s & $/ Pair \\ \hline Inventory Storage Costs (on Y17 carried over) & 185 & 0.10 & 194 & 0.07 & 233 & 0.09 & 827 & 0.19 & 1,439 & 0.12 \\ \hline Packaging/Shipping Costs - Internet & 5,591 & 3.08 & 11,246 & 4.03 & 8,602 & 3.19 & 16,774 & 3.84 & 42,213 & 3.62 \\ \hline Wholesale & 5,331 & 2.93 & 6,985 & 2.50 & 7,347 & 2.73 & 10,536 & 2.41 & 30,199 & 2.59 \\ \hline Warehouse Lease and Maintenance & 1,000 & 0.55 & 1,000 & 0.36 & 1,000 & 0.37 & 1,000 & 0.23 & 4,000 & 0.34 \\ \hline Total Warehouse Operating Expenses & 12,107 & 6.66 & 19,425 & 6.96 & 17,182 & 6.38 & 29,137 & 6.67 & 77,851 & 6.67 \\ \hline \end{tabular}
 Step by Step Solution
There are 3 Steps involved in it
Step: 1

Get Instant Access to Expert-Tailored Solutions
See step-by-step solutions with expert insights and AI powered tools for academic success
Step: 2

Step: 3
Ace Your Homework with AI
Get the answers you need in no time with our AI-driven, step-by-step assistance
Get Started
Financial Accounting An Integrated Statements Approach
Authors: Jonathan E. Duchac, James M. Reeve, Carl S. Warren
2nd Edition
324312113, 978-0324312119