PART 1 Instructions a) Complete the Excel file b) Example 3 contains a process where a single product is assembled. One component of the product
PART 1
Instructions
a) Complete the Excel file
b) Example 3 contains a process where a single product is assembled. One component of the product goes through sawing and sanding and another goes through drilling. Then the two get welded at the welding station. After welding the product goes to one of the assembly stations (parallel stations) and exits the process. Which activity is the bottleneck in this process? What is the hourly capacity of the system. Complete the simulation in Example 3 for five products. Does the simulation confirm the bottleneck you identified?
c) In Example 3, if you want to increase the capacity by at least 20%, what kind of changes you need to do? What is the new capacity?
PART 2
Visit a retailer website and choose two related and comparable products from two different competitors. Alternatively, you can use your own company's complaint database or the Google Review page. Sort the reviews for the products by their lowest ratings. Pick at least 30 bad reviews for each product and classify the complaints you found in them into up to five categories. Then use a runs chart, Pareto chart and a fishbone diagram to analyze your data and provide a discussion on your findings.
PART 3
Part 3 has 5 question – YOU only need to answer FOUR (choose 4 out of 5)
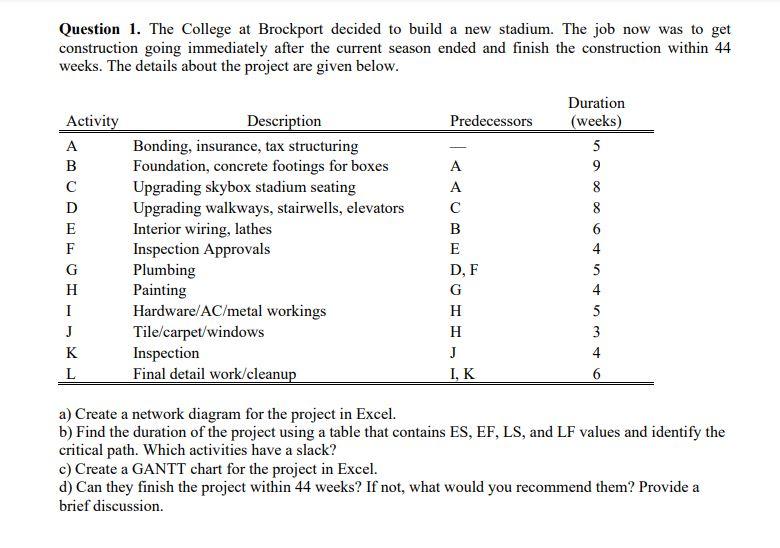
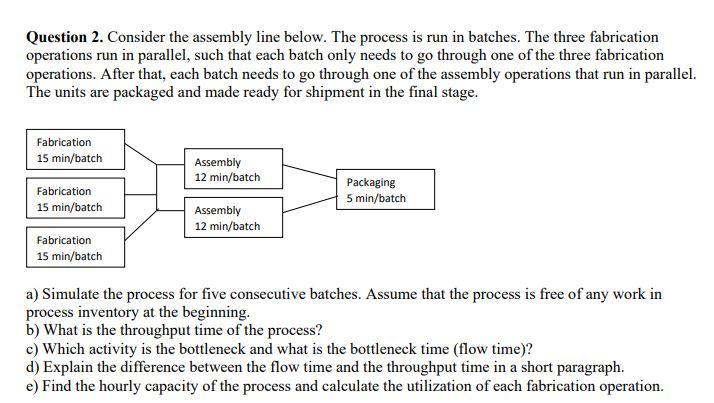
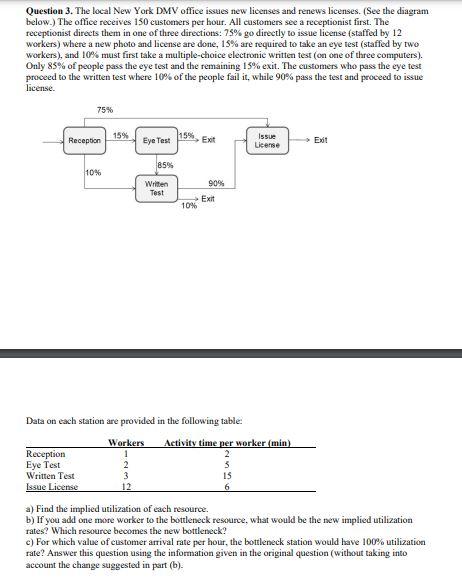
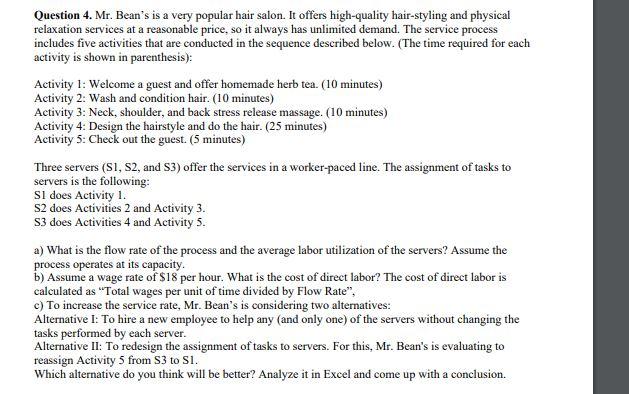

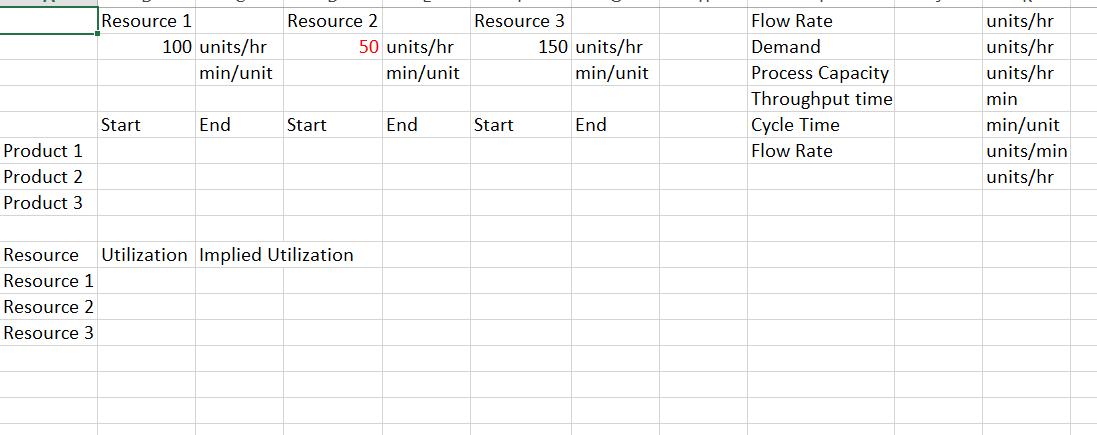
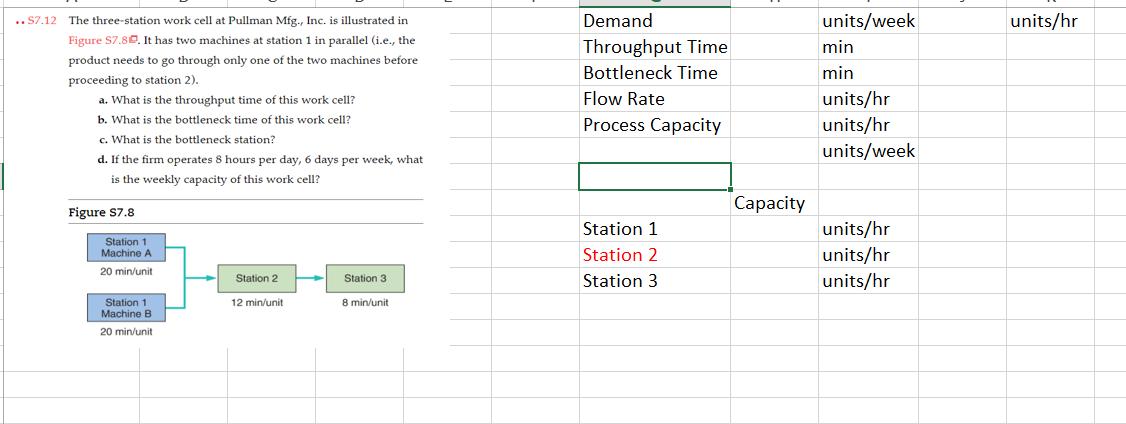
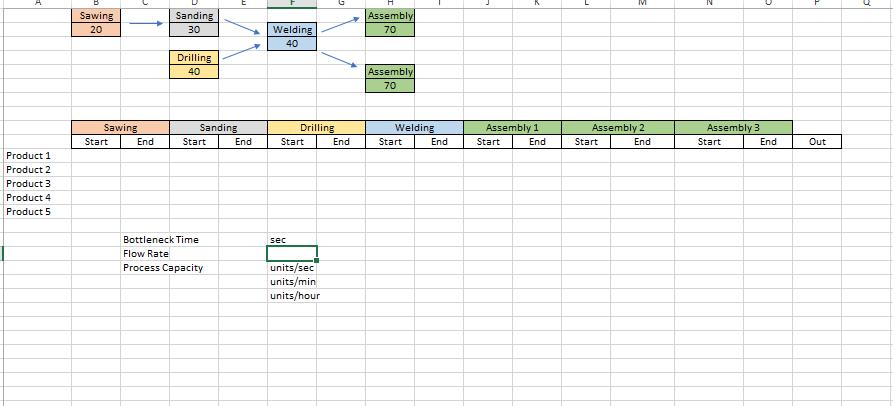
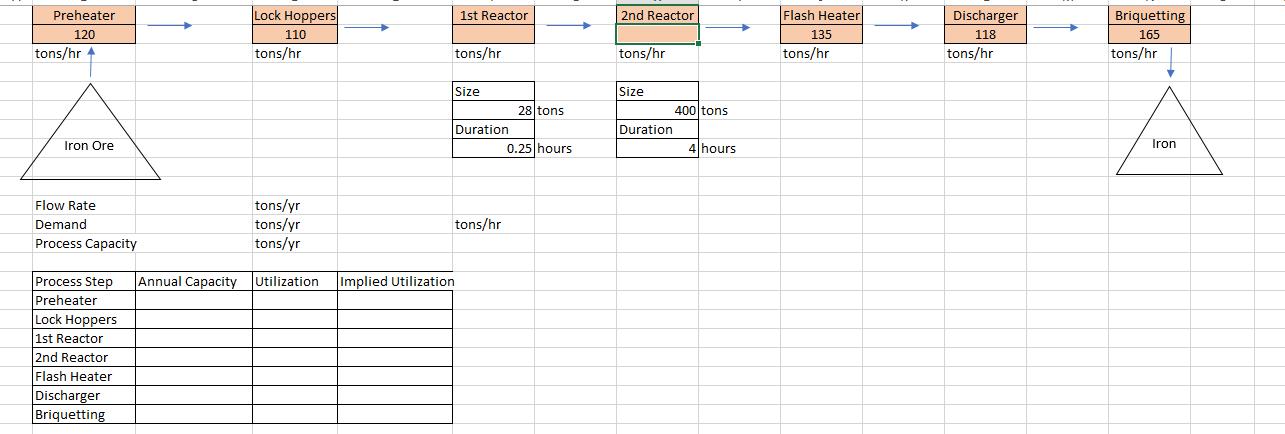
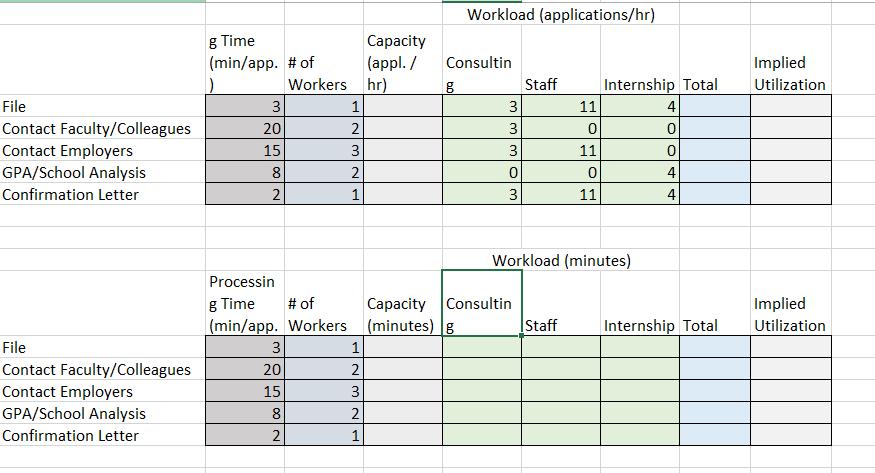
Question 1. The College at Brockport decided to build a new stadium. The job now was to get construction going immediately after the current season ended and finish the construction within 44 weeks. The details about the project are given below. Activity A B C D E F G H I J K L Description Bonding, insurance, tax structuring Foundation, concrete footings for boxes Upgrading skybox stadium seating Upgrading walkways, stairwells, elevators Interior wiring, lathes Inspection Approvals Plumbing Painting Hardware/AC/metal workings Tile/carpet/windows Inspection Final detail work/cleanup Predecessors A A C B E D, F G H H J I, K Duration (weeks) 5 9 8 0 60 50 40 3 t 6 5 4 5 3 4 6 a) Create a network diagram for the project in Excel. b) Find the duration of the project using a table that contains ES, EF, LS, and LF values and identify the critical path. Which activities have a slack? c) Create a GANTT chart for the project in Excel. d) Can they finish the project within 44 weeks? If not, what would you recommend them? Provide a brief discussion. Question 2. Consider the assembly line below. The process is run in batches. The three fabrication operations run in parallel, such that each batch only needs to go through one of the three fabrication operations. After that, each batch needs to go through one of the assembly operations that run in parallel. The units are packaged and made ready for shipment in the final stage. Fabrication 15 min/batch Fabrication 15 min/batch Fabrication 15 min/batch Assembly 12 min/batch Assembly 12 min/batch Packaging 5 min/batch a) Simulate the process for five consecutive batches. Assume that the process is free of any work in process inventory at the beginning. b) What is the throughput time of the process? c) Which activity is the bottleneck and what is the bottleneck time (flow time)? d) Explain the difference between the flow time and the throughput time in a short paragraph. e) Find the hourly capacity of the process and calculate the utilization of each fabrication operation. Question 3. The local New York DMV office issues new licenses and renews licenses. (See the diagram below.) The office receives 150 customers per hour. All customers see a receptionist first. The receptionist directs them in one of three directions: 75% go directly to issue license (staffed by 12 workers) where a new photo and license are done, 15% are required to take an eye test (staffed by two workers), and 10% must first take a multiple-choice electronic written test (on one of three computers). Only 85% of people pass the eye test and the remaining 15% exit. The customers who pass the eye test proceed to the written test where 10% of the people fail it, while 90% pass the test and proceed to issue license. Reception Eye Test 75% Reception Written Test Issue License. 10% 15% Eye Test 85% Written Test Workers 1 2 3 12 15% 10% Exit Data on each station are provided in the following table: 90% Exit Issue License Activity time per worker (min) 2 3 15 6 > Exit a) Find the implied utilization of each resource. b) If you add one more worker to the bottleneck resource, what would be the new implied utilization rates? Which resource becomes the new bottleneck? c) For which value of customer arrival rate per hour, the bottleneck station would have 100% utilization rate? Answer this question using the information given in the original question (without taking into account the change suggested in part (b). Question 4. Mr. Bean s is a very popular hair salon. It offers high-quality hair-styling and physical relaxation services at a reasonable price, so it always has unlimited demand. The service process includes five activities that are conducted in the sequence described below. (The time required for each activity is shown in parenthesis): Activity 1: Welcome a guest and offer homemade herb tea. (10 minutes) Activity 2: Wash and condition hair. (10 minutes) Activity 3: Neck, shoulder, and back stress release massage. (10 minutes) Activity 4: Design the hairstyle and do the hair. (25 minutes) Activity 5: Check out the guest. (5 minutes) Three servers (S1, S2, and S3) offer the services in a worker-paced line. The assignment of tasks to servers is the following: SI does Activity 1. S2 does Activities 2 and Activity 3. S3 does Activities 4 and Activity 5. a) What is the flow rate of the process and the average labor utilization of the servers? Assume the process operates at its capacity. b) Assume a wage rate of $18 per hour. What is the cost of direct labor? The cost of direct labor is calculated as Total wages per unit of time divided by Flow Rate , c) To increase the service rate, Mr. Bean s is considering two alternatives: Alternative I: To hire a new employee to help any (and only one) of the servers without changing the tasks performed by each server. Alternative II: To redesign the assignment of tasks to servers. For this, Mr. Bean s is evaluating to reassign Activity 5 from $3 to Sl. Which alternative do you think will be better? Analyze it in Excel and come up with a conclusion. Question 5. Find a process in the How It s Made channel on YouTube and create a process flow diagram for the process. Explain the process flow and discuss where you think that the bottleneck may occur in this specific process. Alternatively, you can consider a process at your workplace. Product 1 Product 2 Product 3 Resource 1 Start 100 units/hr min/unit End Resource 2 Start Resource Utilization Implied Utilization Resource 1 Resource 2 Resource 3 50 units/hr min/unit End Resource 3 Start 150 units/hr min/unit End Flow Rate Demand Process Capacity Throughput time Cycle Time Flow Rate units/hr units/hr units/hr min min/unit units/min units/hr ..S7.12 The three-station work cell at Pullman Mfg., Inc. is illustrated in Figure $7.80. It has two machines at station 1 in parallel (i.e., the product needs to go through only one of the two machines before. proceeding to station 2). a. What is the throughput time of this work cell? b. What is the bottleneck time of this work cell? c. What is the bottleneck station? d. If the firm operates 8 hours per day, 6 days per week, what is the weekly capacity of this work cell? Figure $7.8 Station 1 Machine A 20 min/unit Station 1 Machine B 20 min/unit Station 2 12 min/unit Station 3 8 min/unit Demand Throughput Time Bottleneck Time Flow Rate Process Capacity Station 1 Station 2 Station 3 Capacity units/week min min units/hr units/hr units/week units/hr units/hr units/hr units/hr Product 1 Product 2 Product 3 Product 4 Product 5 Sawing 20 Sawing Start End Sanding 30 Drilling 40 Sanding Start Bottleneck Time Flow Rate Process Capacity End X Welding 40 Drilling Start sec units/sec units/min units/hour End Assembly 70 Assembly 70 Welding Start End Assembly 1 End Start M Assembly 2 Start End N Assembly 3 Start D End Out J Preheater 120 tons/hr 4 Iron Ore Flow Rate Demand Process Capacity Process Step Annual Capacity Preheater Lock Hoppers 1st Reactor 2nd Reactor Flash Heater Discharger Briquetting Lock Hoppers 110 tons/hr 1st Reactor tons/hr Size tons/yr tons/yr tons/yr Utilization Implied Utilization Duration tons/hr 28 tons 0.25 hours 2nd Reactor tons/hr Size Duration 400 tons 4 hours Flash Heater 135 tons/hr Discharger 118 tons/hr Briquetting 165 tons/hr Iron File Contact Faculty/Colleagues Contact Employers GPA/School Analysis Confirmation Letter File Contact Faculty/Colleagues Contact Employers GPA/School Analysis Confirmation Letter g Time (min/app. # of 3 20 15 8 2 3 20 15 8 N Workers 2 1 2 322N 2 1 Processin g Time # of (min/app. Workers (minutes) g Capacity (appl. / hr) 1 2 3 2 1 Consultin g Workload (applications/hr) 3 3 3 0 3 Staff Capacity Consultin 11 0 Staff 11 0 11 Workload (minutes) Internship Total 4 0 0 4 4 Internship Total Implied Utilization Implied Utilization
Step by Step Solution
3.40 Rating (163 Votes )
There are 3 Steps involved in it
Step: 1

See step-by-step solutions with expert insights and AI powered tools for academic success
Step: 2

Step: 3

Ace Your Homework with AI
Get the answers you need in no time with our AI-driven, step-by-step assistance
Get Started


