Answered step by step
Verified Expert Solution
Question
1 Approved Answer
Part 1 - Investment Appraisal / Cost of Capital Year 4 Year 5 Year 6 Year 7 Year 8 Table A - Investment Project A-new
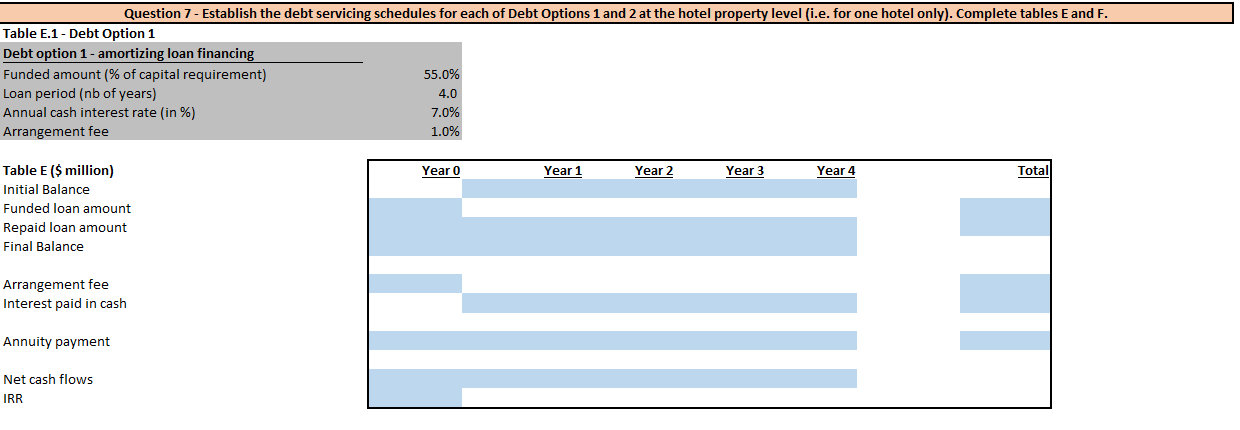
Part 1 - Investment Appraisal / Cost of Capital Year 4 Year 5 Year 6 Year 7 Year 8 Table A - Investment Project A-new hotel development ($ million) Investment cash flows Operating cash flows Final year value Year 1 -8.0 Year 2 -6.0 2.0 Year 3 -1.0 3.0 3.5 4.0 4.5 5.0 5.5 15.0 Year 3 Year 4 Year 5 Year 6 Year 0 -4.0 Table B - Investment Project B-existing hotel acquisition ($ million) Investment cash flows Operating cash flows Final year value Year 3 Yearo Year 7 Year 1 -2.0 Yeara Years Year 8 Year? Years Year 2 -1.0 1.0 Year6 Year? Year 8 - 1.5 2.0 2.2 2.5 27 3.0 8.0 Table C Debt Equity Cost of Debt Cost of Equity Tax Rate 50.0% 50.0% 10.0% 25.0% 20.0% Part 2 - Raising Debt Table D - Investment Project C-renovation of existing hotels - cash flow profile for 1 hotel Year o Year 1 Year 2 Year 3 Year 0 -3.0 Year 4 = ($ million) - Investment cash flows - Increase in hotel operating cash flows Final year value -Net renovation cash flows per hotel Year 1 0.5 0.5 Year 2 0.8 0.8 0.8 Year 3 1.0 1.0 1.0 Year 4 1.0 3:0 -3.0 -3.0 0.5 0.8 Question 7 - Establish the debt servicing schedules for each of Debt Options 1 and 2 at the hotel property level (i.e. for one hotel only). Complete tables E and F. Table E.1 - Debt Option 1 Debt option 1 - amortizing loan financing Funded amount (% of capital requirement) 55.0% Loan period (nb of years) 4.0 Annual cash interest rate (in %) 7.0% Arrangement fee 1.0% Year 0 Year 1 Year 2 Year 3 Year 4 Total Table E ($ million) Initial Balance Funded loan amount Repaid loan amount Final Balance Arrangement fee Interest paid in cash Annuity payment Net cash flows IRR Part 1 - Investment Appraisal / Cost of Capital Year 4 Year 5 Year 6 Year 7 Year 8 Table A - Investment Project A-new hotel development ($ million) Investment cash flows Operating cash flows Final year value Year 1 -8.0 Year 2 -6.0 2.0 Year 3 -1.0 3.0 3.5 4.0 4.5 5.0 5.5 15.0 Year 3 Year 4 Year 5 Year 6 Year 0 -4.0 Table B - Investment Project B-existing hotel acquisition ($ million) Investment cash flows Operating cash flows Final year value Year 3 Yearo Year 7 Year 1 -2.0 Yeara Years Year 8 Year? Years Year 2 -1.0 1.0 Year6 Year? Year 8 - 1.5 2.0 2.2 2.5 27 3.0 8.0 Table C Debt Equity Cost of Debt Cost of Equity Tax Rate 50.0% 50.0% 10.0% 25.0% 20.0% Part 2 - Raising Debt Table D - Investment Project C-renovation of existing hotels - cash flow profile for 1 hotel Year o Year 1 Year 2 Year 3 Year 0 -3.0 Year 4 = ($ million) - Investment cash flows - Increase in hotel operating cash flows Final year value -Net renovation cash flows per hotel Year 1 0.5 0.5 Year 2 0.8 0.8 0.8 Year 3 1.0 1.0 1.0 Year 4 1.0 3:0 -3.0 -3.0 0.5 0.8 Question 7 - Establish the debt servicing schedules for each of Debt Options 1 and 2 at the hotel property level (i.e. for one hotel only). Complete tables E and F. Table E.1 - Debt Option 1 Debt option 1 - amortizing loan financing Funded amount (% of capital requirement) 55.0% Loan period (nb of years) 4.0 Annual cash interest rate (in %) 7.0% Arrangement fee 1.0% Year 0 Year 1 Year 2 Year 3 Year 4 Total Table E ($ million) Initial Balance Funded loan amount Repaid loan amount Final Balance Arrangement fee Interest paid in cash Annuity payment Net cash flows IRR
Step by Step Solution
There are 3 Steps involved in it
Step: 1
Get Instant Access to Expert-Tailored Solutions
See step-by-step solutions with expert insights and AI powered tools for academic success
Step: 2
Step: 3
Ace Your Homework with AI
Get the answers you need in no time with our AI-driven, step-by-step assistance
Get Started