

Answered step by step
Verified Expert Solution
Question
1 Approved Answer
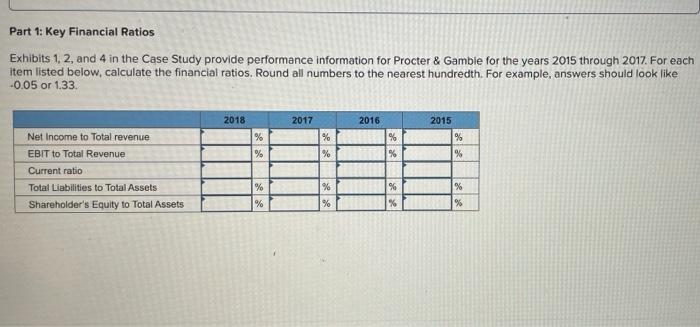
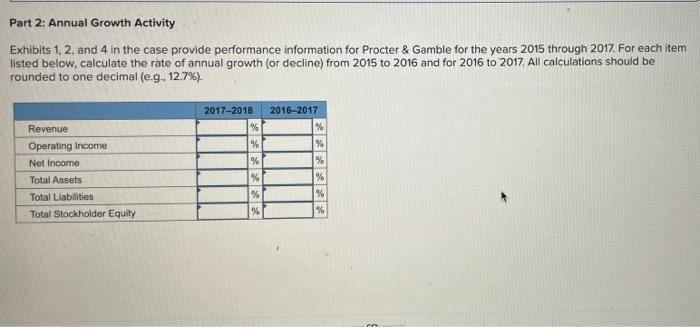
Part 1: Key Financial Ratios Exhibits 1.2 and 4 in the Case Study provide performance information for Procter & Gamble for the years 2015 through
Step by Step Solution
There are 3 Steps involved in it
Step: 1

Get Instant Access to Expert-Tailored Solutions
See step-by-step solutions with expert insights and AI powered tools for academic success
Step: 2

Step: 3
Ace Your Homework with AI
Get the answers you need in no time with our AI-driven, step-by-step assistance
Get Started
The Handbook Of Post Crisis Financial Modelling
Authors: Emmanuel Haven, Philip Molyneux, John Wilson, Sergei Fedotov, Meryem Duygun
1st Edition
1137494484, 978-1137494481