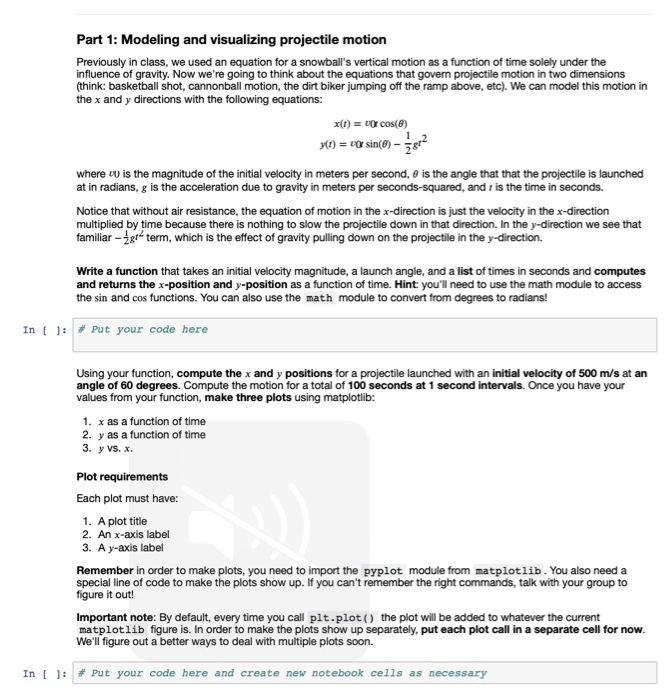
Part 1: Modeling and visualizing projectile motion Previously in class, we used an equation for a snowball's vertical motion as a function of time solely under the influence of gravity. Now we're going to think about the equations that govern projectile motion in two dimensions (think: basketball shot, cannonball motion, the dirt biker jumping off the ramp above, etc). We can model this motion in the x and y directions with the following equations: xlt)urcos(e) where is the magnitude of the initial velocity in meters per second, is the angle that that the projectile is launched at in radians, g is the acceleration due to gravity in meters per seconds-squared, and is the time in seconds. Notice that without air resistance, the equation of motion in the x-direction is just the velocity in the x-direction multiplied by time because there is nothing to slow the projectile down in that direction. In the y-direction we see that familiarg term, which is the effect of gravity pulling down on the projectile in the y-direction. Write a function that takes an initial velocity magnitude, a launch angle, and a list of times in seconds and computes and returns the x-position and y-position as a function of time. Hint you'll need to use the math module to access the sin and cos functions. You can also use the math module to convert from degrees to radians! In [ ]: # Put your code here Using your function, compute the x and y positions for a projectile launched with an initial velocity of 500 m/s at an angle of 60 degrees. Compute the motion for a total of 100 seconds at 1 second intervals. Once you have your values from your function, make three plots using matplotlib: 1. x as a function of time 2. y as a function of time 3, y vs. x. Plot requirements Each plot must have: 1. A plot title 2. An x-axis label 3. A y-axis label Remember in order to make plots, you need to import the pyplot module from matplotlib. You also need a special line of code to make the plots show up. If you can't remember the right commands, talk with your group to figure it out! Important note: By default, every time you call plt.plot() the plot will be added to whatever the current matplotlib figure is. In order to make the plots show up separately, put each plot call in a separate cell for now We'll figure out a better ways to deal with multiple plots soon. In [ ]: # Put your code here and create new notebook cells as necessary


