

Question
Part 1 of 2 - Graph to follow You have decided to diversify a portfolio with 70% invested in large-cap equities, 25 % in bonds
Part 1 of 2 - Graph to follow
You have decided to diversify a portfolio with 70% invested in large-cap equities, 25 % in bonds and 5% in a money market fund. The information you have been given is that Vanguard 500Index Fund is essentially identical to your index funds. For the 20 investment periods shown in the graph (1986-2014), in only 7 of these periods did more than 50 % of the mutual fund managers beat the Vanguard 500 Index Fund. Using the graph- Is the graph consistent with market efficiency and what investment would you make with the equity portion of your account?
Please explain your steps and rational, I am really trying to understand this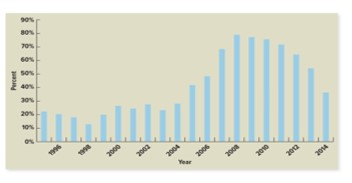
Step by Step Solution
There are 3 Steps involved in it
Step: 1

Get Instant Access to Expert-Tailored Solutions
See step-by-step solutions with expert insights and AI powered tools for academic success
Step: 2

Step: 3
Ace Your Homework with AI
Get the answers you need in no time with our AI-driven, step-by-step assistance
Get Started
The Pillars Of Finance The Misalignment Of Finance Theory And Investment Practice
Authors: G. Fraser-Sampson
2014th Edition
1137264055, 978-1137264053