PART 1: Research #1 (Categorical : One-sample Proportion Test) A. Research Question: As indicated in our lesson, a hypothesis test qguestion is a yeso question.
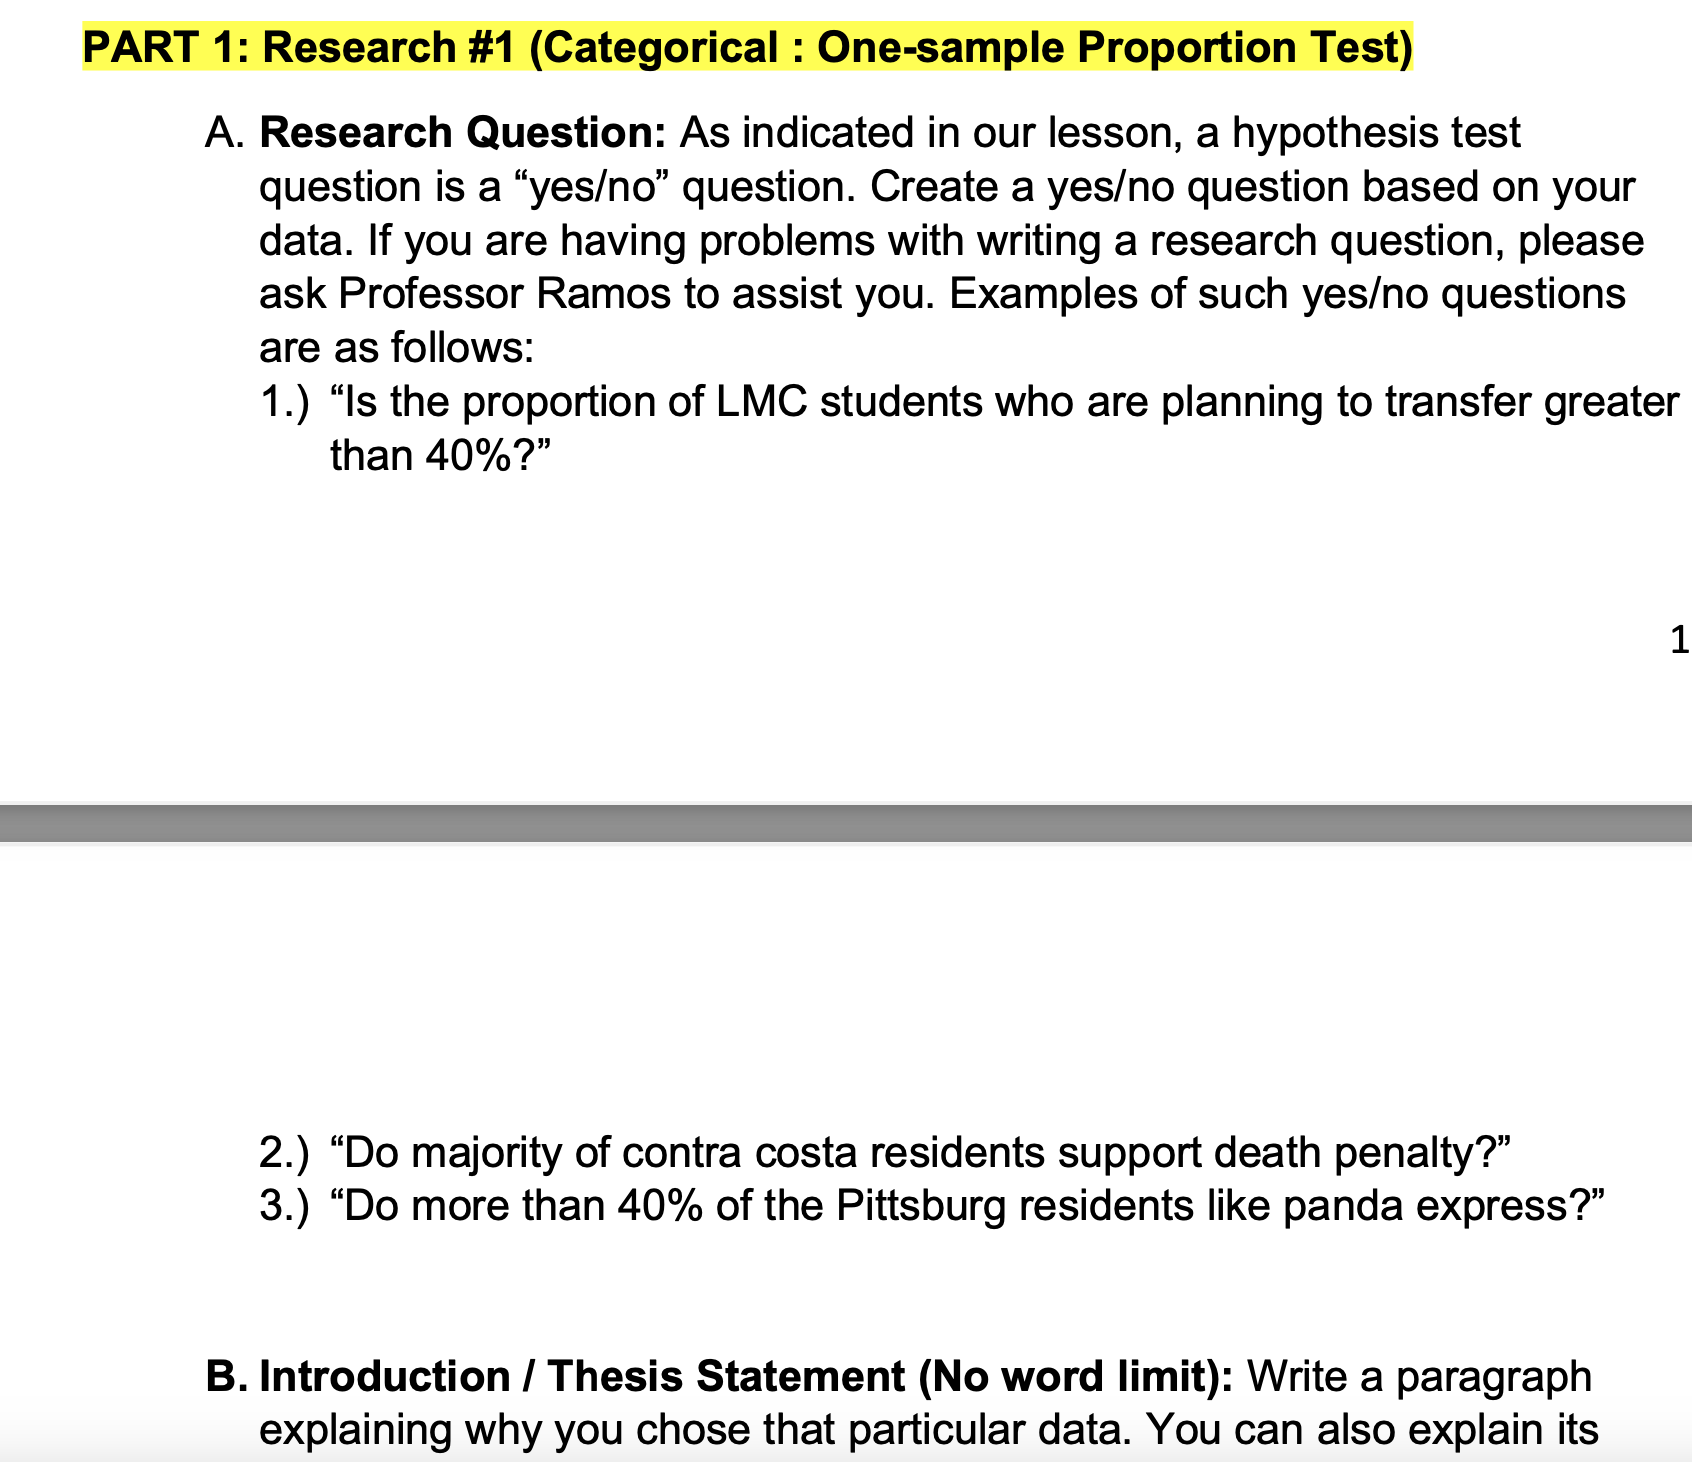
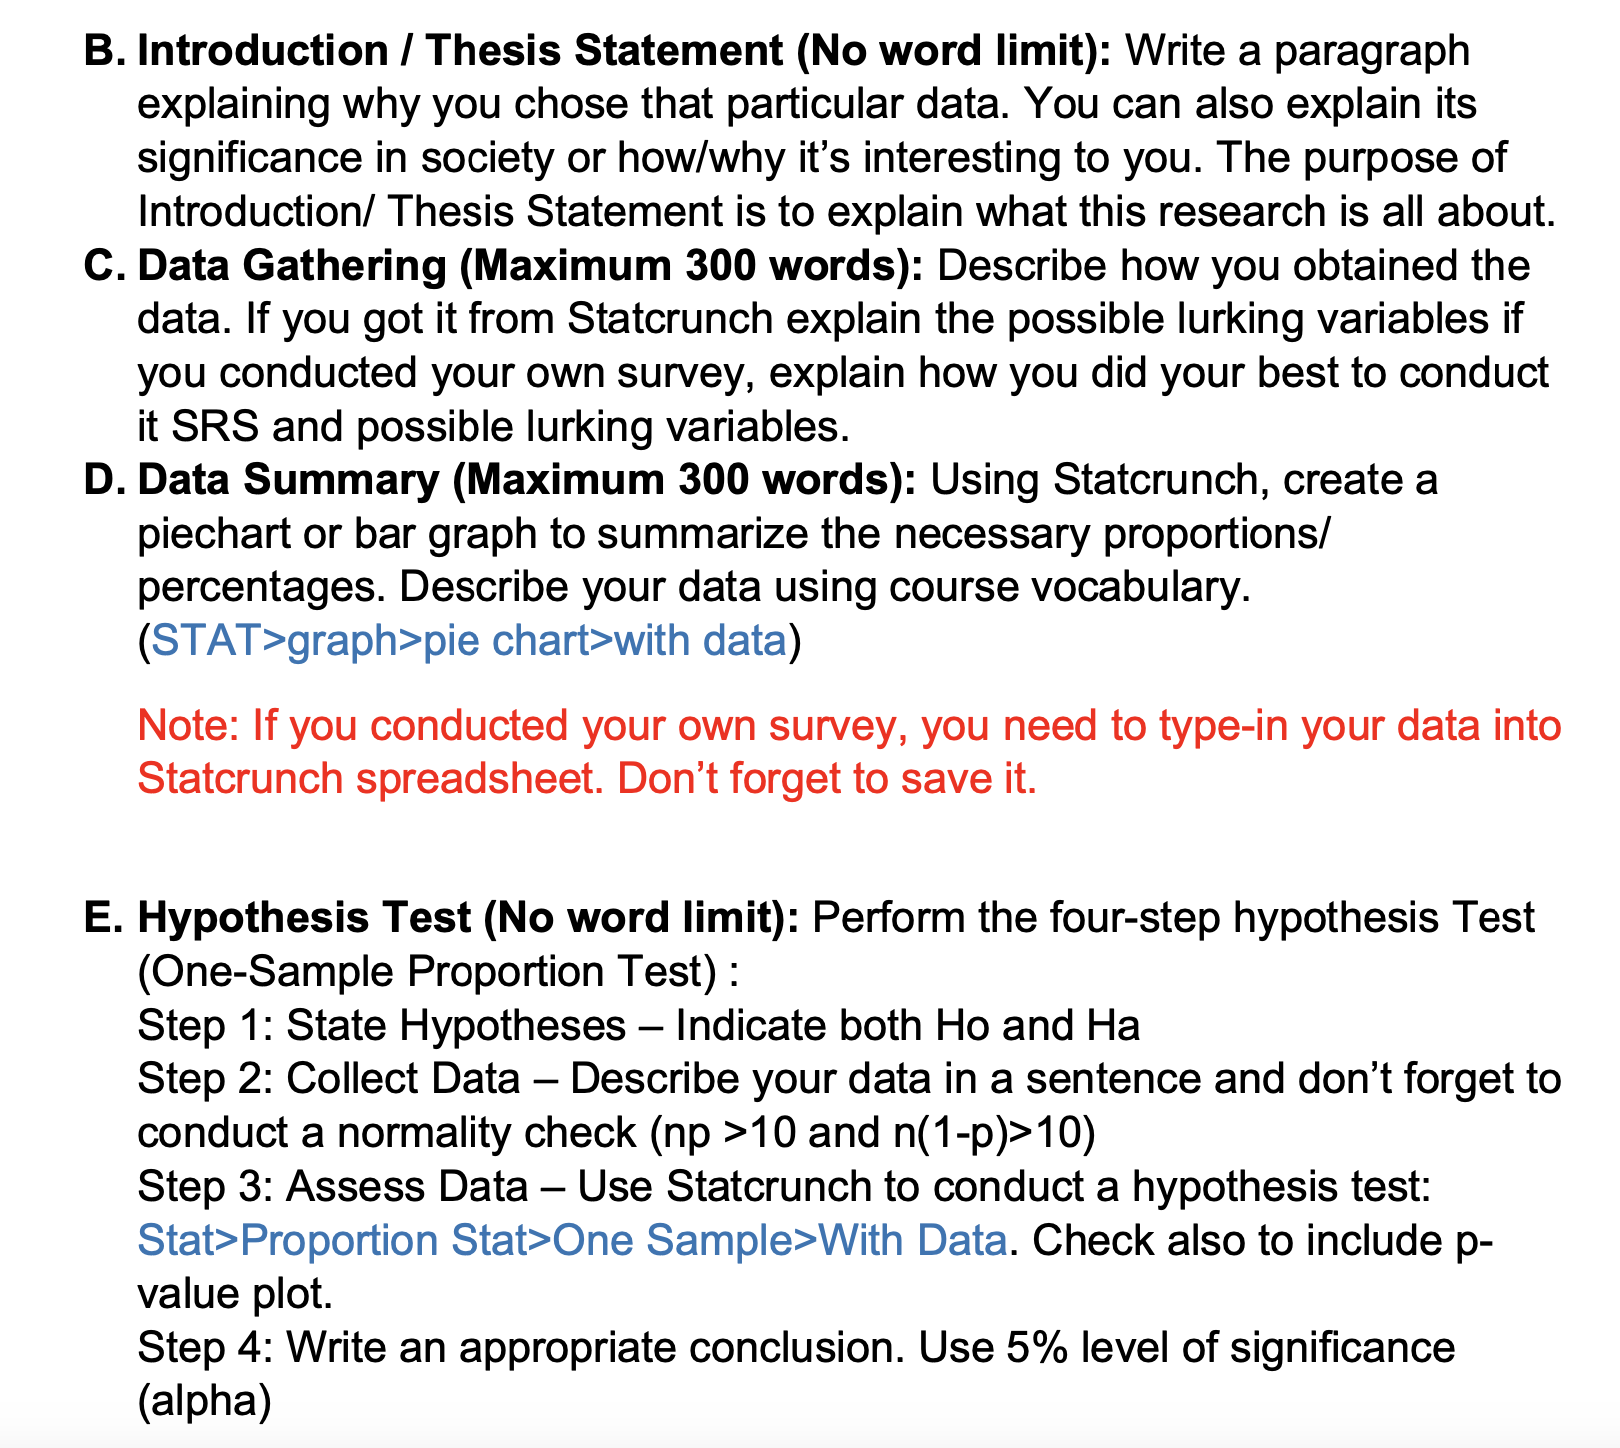
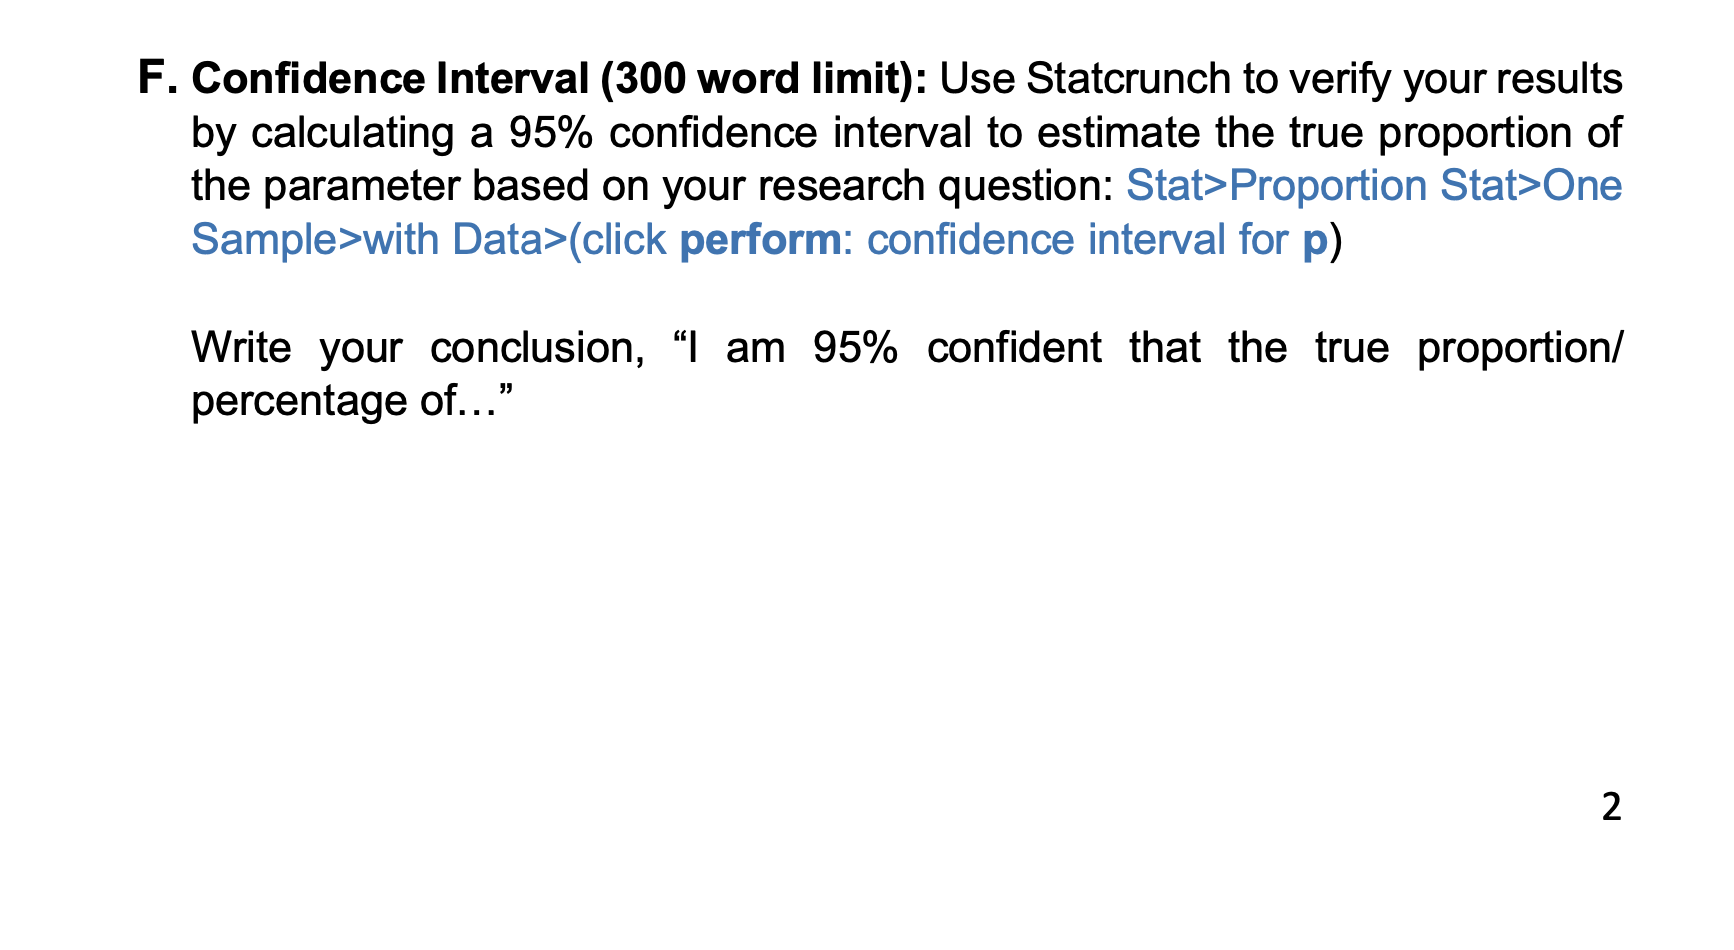
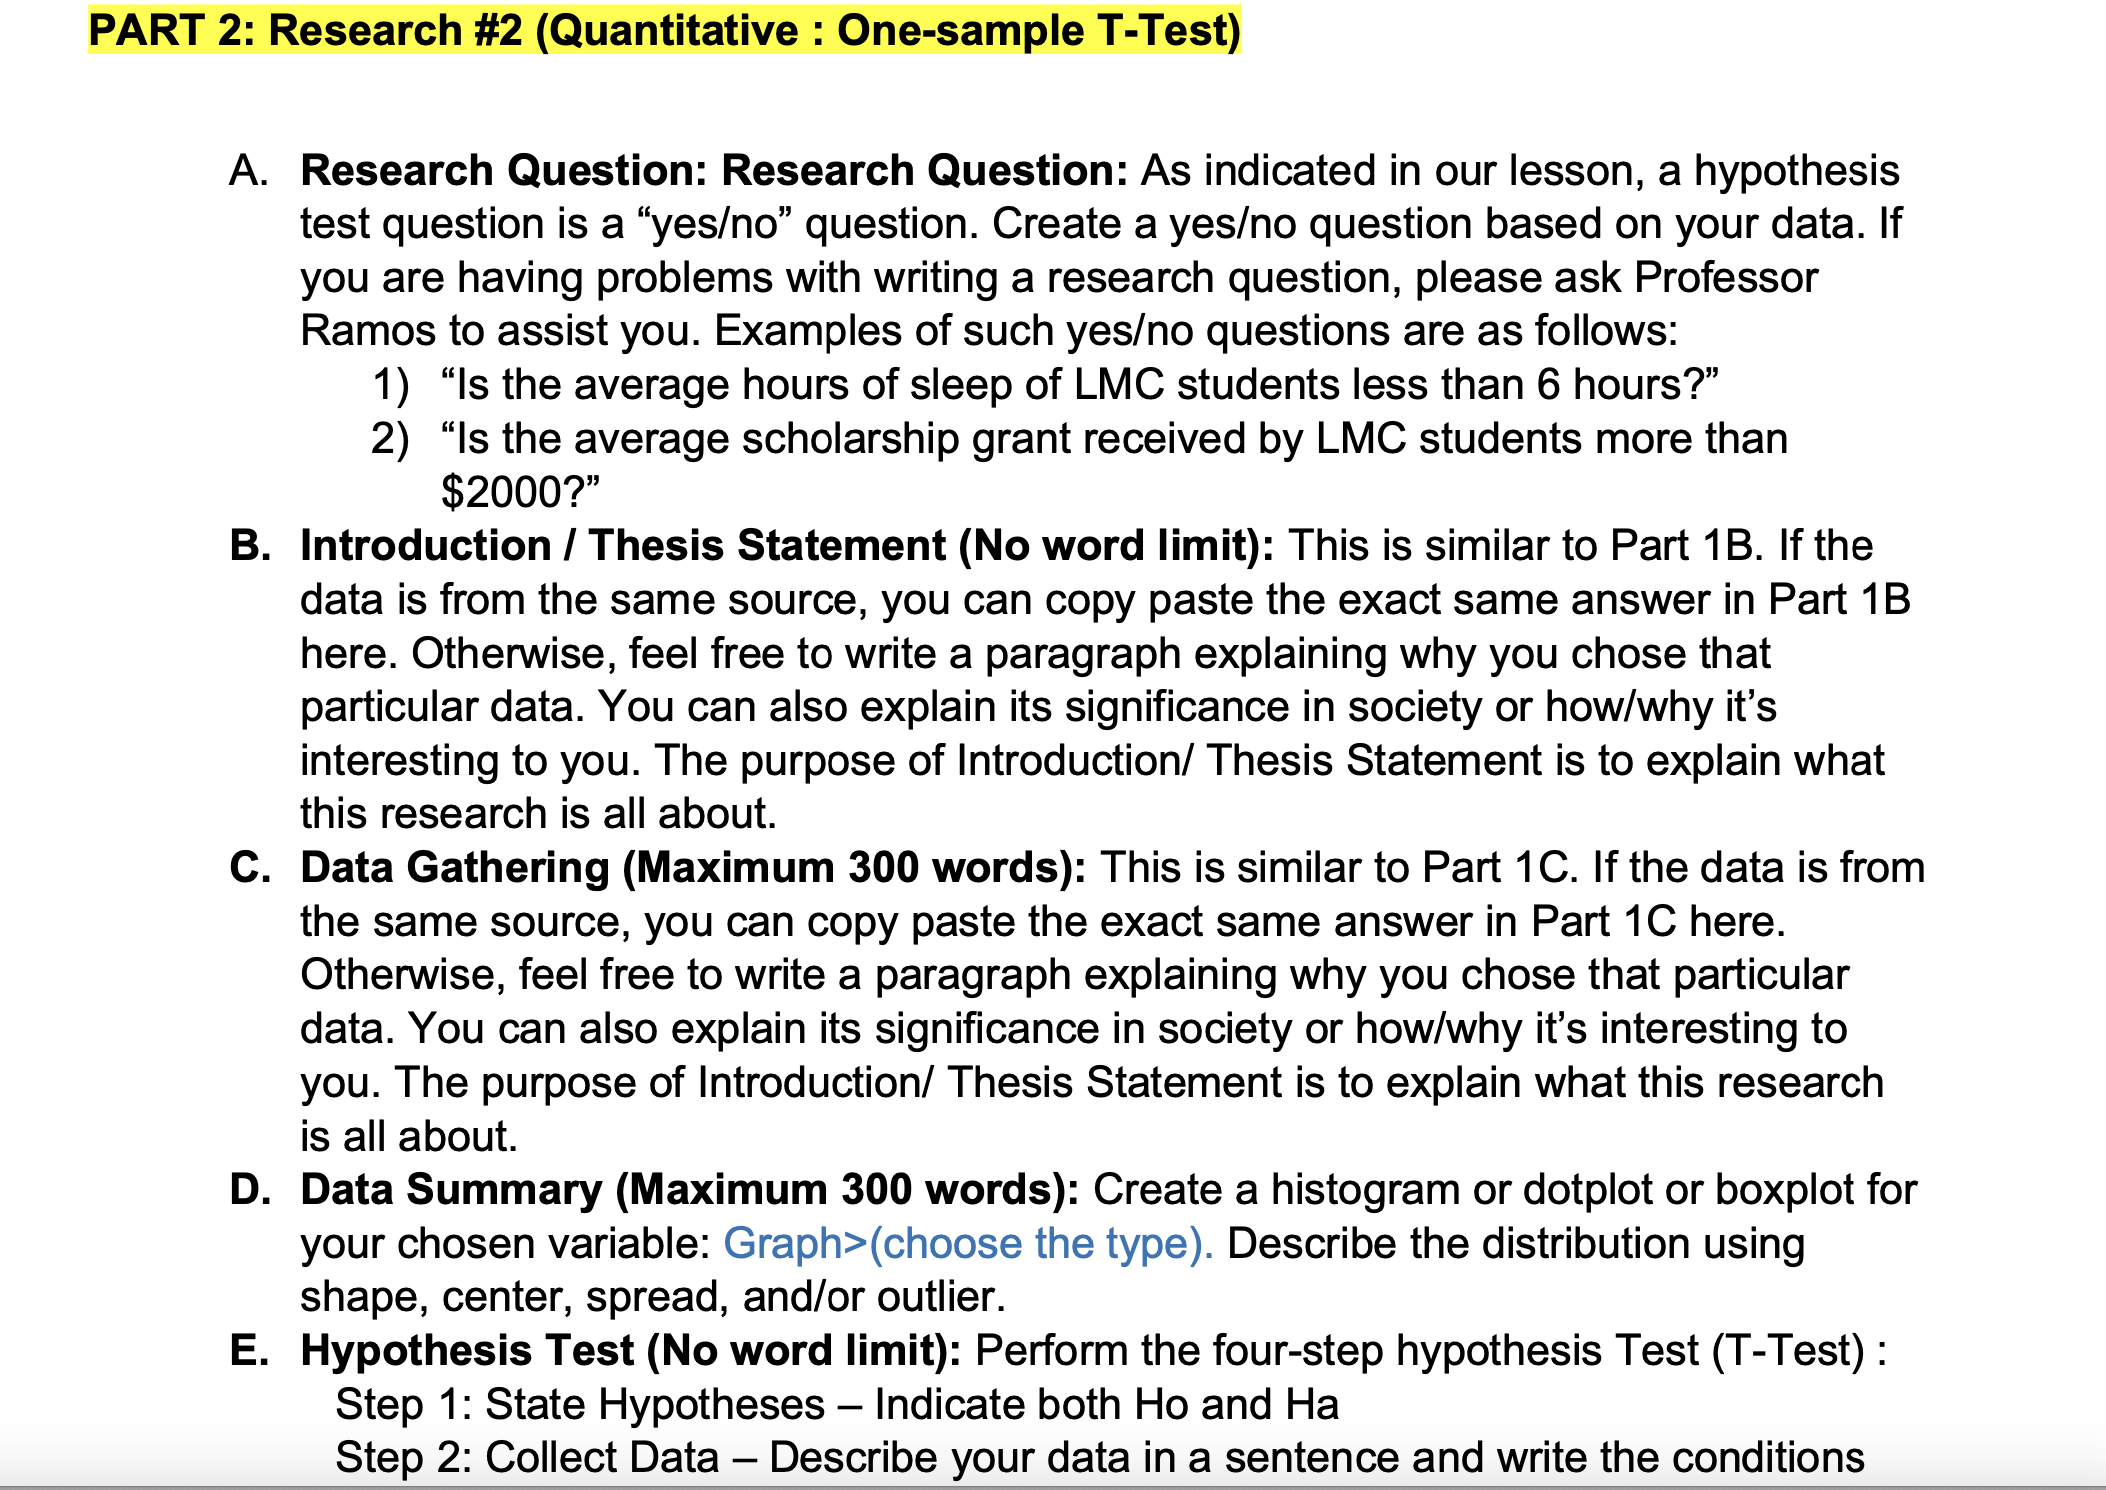
PART 1: Research #1 (Categorical : One-sample Proportion Test) A. Research Question: As indicated in our lesson, a hypothesis test qguestion is a \"yeso\" question. Create a yeso question based on your data. If you are having problems with writing a research question, please ask Professor Ramos to assist you. Examples of such yeso questions are as follows: 1.) \"Is the proportion of LMC students who are planning to transfer greater than 40%7?\" 2.) \"Do maijority of contra costa residents support death penalty?\" 3.) \"Do more than 40% of the Pittsburg residents like panda express?\" B. Introduction / Thesis Statement (No word limit): Write a paragraph explaining why you chose that particular data. You can also explain its B. Introduction / Thesis Statement (No word limit): Write a paragraph explaining why you chose that particular data. You can also explain its significance in society or how/why it's interesting to you. The purpose of Introduction/ Thesis Statement is to explain what this research is all about. C. Data Gathering (Maximum 300 words): Describe how you obtained the data. If you got it from Statcrunch explain the possible lurking variables if you conducted your own survey, explain how you did your best to conduct it SRS and possible lurking variables. D. Data Summary (Maximum 300 words): Using Statcrunch, create a piechart or bar graph to summarize the necessary proportions/ percentages. Describe your data using course vocabulary. (STAT>graph>pie chart>with data) Note: If you conducted your own survey, you need to type-in your data into Statcrunch spreadsheet. Don't forget to save it. E. Hypothesis Test (No word limit): Perform the four-step hypothesis Test (One-Sample Proportion Test) : Step 1: State Hypotheses Indicate both Ho and Ha Step 2: Collect Data Describe your data in a sentence and don''t forget to conduct a normality check (np >10 and n(1-p)>10) Step 3: Assess Data Use Statcrunch to conduct a hypothesis test: Stat>Proportion Stat>One Sample>With Data. Check also to include p- value plot. Step 4: Write an appropriate conclusion. Use 5% level of significance (alpha) F. Confidence Interval (300 word limit): Use Statcrunch to verify your results by calculating a 95% confidence interval to estimate the true proportion of the parameter based on your research question: Stat>Proportion Stat>One Sample>with Data>(click perform: confidence interval for p) Write your conclusion, \"l am 95% confident that the true proportion/ percentage of...\" PART 2: Research #2 (Quantitative : One-sample T-Test) A. Research Question: Research Question: As indicated in our lesson, a hypothesis test question is a \"yeso\" question. Create a yeso question based on your data. If you are having problems with writing a research question, please ask Professor Ramos to assist you. Examples of such yeso questions are as follows: 1) \"Is the average hours of sleep of LMC students less than 6 hours?\" 2) \"Is the average scholarship grant received by LMC students more than $2000?\" . Introduction / Thesis Statement (No word limit): This is similar to Part 1B. If the data is from the same source, you can copy paste the exact same answer in Part 1B here. Otherwise, feel free to write a paragraph explaining why you chose that particular data. You can also explain its significance in society or how/why it's interesting to you. The purpose of Introduction/ Thesis Statement is to explain what this research is all about. Data Gathering (Maximum 300 words): This is similar to Part 1C. If the data is from the same source, you can copy paste the exact same answer in Part 1C here. Otherwise, feel free to write a paragraph explaining why you chose that particular data. You can also explain its significance in society or how/why it's interesting to you. The purpose of Introduction/ Thesis Statement is to explain what this research is all about. Data Summary (Maximum 300 words): Create a histogram or dotplot or boxplot for your chosen variable: Graph>(choose the type). Describe the distribution using shape, center, spread, and/or outlier. Hypothesis Test (No word limit): Perform the four-step hypothesis Test (T-Test) : Step 1: State Hypotheses Indicate both Ho and Ha Step 2: Collect Data Describe your data in a sentence and write the conditions snape, center, spreaa, ana/or ouuier. E. Hypothesis Test (No word limit): Perform the four-step hypothesis Test (T-Test) : Step 1: State Hypotheses Indicate both Ho and Ha Step 2: Collect Data Describe your data in a sentence and write the conditions for t-test. Note that since n = 30 or higher, this should automatically pass the normality check. Step 3: Assess Data Use Statcrunch to conduct a hypothesis test: Stat>T- Stats>One Sample>With Data. Check also to include p-value plot. Step 4: Write an appropriate conclusion. Use 5% level of significance (alpha) Note: for step 3, attach both the p-value graph and the result of the hypothesis test. This should be your step 3. F. Confidence Interval (300 word limit): Use Statcrunch to verify your results by calculating a 95% confidence interval to estimate the true proportion of the parameter based on your research question: Stat>T-Stats>One Sample>with Data>(click perform: confidence interval for u) Write your conclusion, \"I am 95% confident that the true proportion/ percentage of...\" PART 3: Summary (No word limit) Summarize all your findings in a single paragraph. This part will mention similar statements from your previous conclusions. Your goal is to explain both research questions to a level where an ordinary person can understand. Make sure you interpret the results in the context of the problem using appropriate vocabulary. Explain the meaning of statistically significant result, confidence level, and p-value in context in case you have not done that. Consider this step as an over-all summary that ties in with your original thesis statement. You can also add any comment you have observed that is worth noting
Step by Step Solution
There are 3 Steps involved in it
Step: 1
Get Instant Access to Expert-Tailored Solutions
See step-by-step solutions with expert insights and AI powered tools for academic success
Step: 2
Step: 3
Ace Your Homework with AI
Get the answers you need in no time with our AI-driven, step-by-step assistance