Answered step by step
Verified Expert Solution
Link Copied!

Question

1 Approved Answer

Part 1: The following table shows the total expenditures in the private, public and foreign sectors in the United States in 2009 and 2010 (in
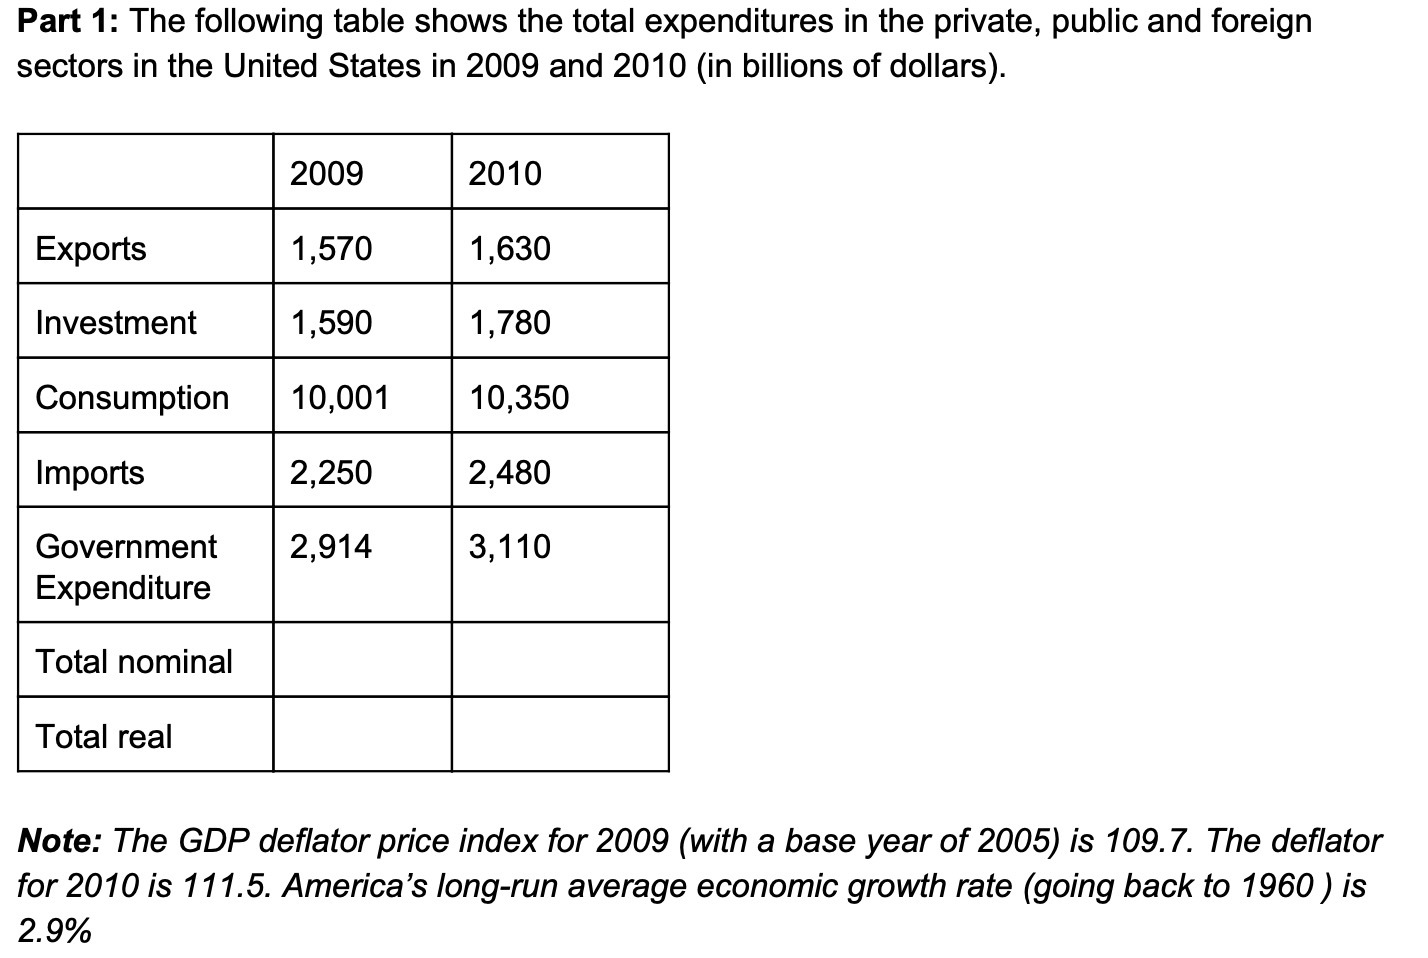
image text in transcribed
Part 1: The following table shows the total expenditures in the private, public and foreign sectors in the United States in 2009 and 2010 (in billions of dollars). 2009 2010 Exports 1,570 1,630 Investment 1,590 1,780 Consumption 10,001 10,350 Imports 2,250 2,480 Government 2,914 3,110 Expenditure Total nominal Total real Note: The GDP deflator price index for 2009 (with a base year of 2005) is 109.7. The deflator for 2010 is 111.5. America's long-run average economic growth rate (going back to 1960 ) is 2.9%

Step by Step Solution

There are 3 Steps involved in it

Step: 1

blur-text-image

Get Instant Access to Expert-Tailored Solutions

See step-by-step solutions with expert insights and AI powered tools for academic success

Step: 2

blur-text-image

Step: 3

blur-text-image

Ace Your Homework with AI

Get the answers you need in no time with our AI-driven, step-by-step assistance

Get Started

Recommended Textbook for

Advanced Placement Microeconomics

Authors: Bill Hurd

1st Edition

1531150306, 978-1531150303

More Books

Students also viewed these Economics questions

Question

=+How might you explain this phenomenon?

Answered: 1 week ago