PART 1:
The world happiness report 2017 provides a happiness score for countries using the data collected by the Gallup World Poll. Assuming happiness score is approximately normal with mean 5.35 with a standard deviation of 1.13, answer the below questions.
What percentage of countries has a happiness score of at least 7.0?
What percentage of countries has a happiness score less than 3.0?
What percentage of countries has a happiness score in between 3.0 and 6.0?
PART 2:
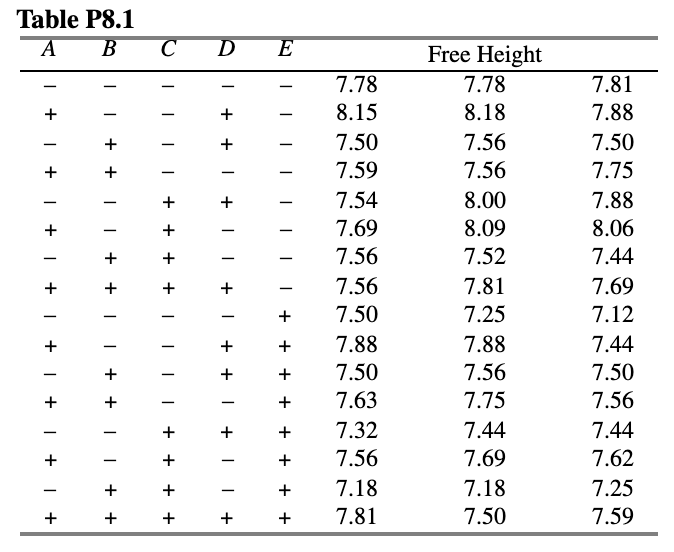
An article by J.J. Pignatiello, Jr. And J.S. Ramberg in the Journal of Quality Technology, (Vol. 17, 1985, pp. 198-206) describes the use of a replicated fractional factorial to investigate the effects of five factors on the free height of leaf springs used in an automotive application. The factors are A = furnace temperature, B = heating time, C = transfer time, D = hold down time, and E = quench oil temperature. The data are shown in Table P81.
Table P8.1 A B C D E Free Height - 7.78 7.78 7.81 + - + - 8.15 8.18 7.88 + + 7.50 7.56 7.50 + + - 7.59 7.56 7.75 7.88 - - + + 7.54 8.00 + - + 7.69 8.09 8.06 7.44 + - 7.56 7.52 7.56 7.81 7.69 + + + + - - - + 7.50 7.25 7.12 + - + + 7.88 7.88 7.44 - + + + 7.50 7.56 7.50 + + - + 7.63 7.75 7.56 - + + + 7.32 7.44 7.44 + - 7.69 + - + 7.56 7.62 + + - + 7.18 7.18 7.25 + + + + + 7.81 7.50 7.59A random sample of nj = 16 communities in western Kansas gave the following rates of hay fever per 1000 population for people under 25 years of age. 121 115 124 99 134 121 110 116 113 96 116 116 135 96 96 116 A random sample of n2 = 14 communities in western Kansas gave the following rates of hay fever per 1000 population for people over 50 years old. 113 86 106 102 113 94 94 108 103 99 78 105 88 100 Assume that the hay fever rate in each age group has an approximately normal distribution. Using the method outlined in Brase and Brase, do the data indicate that the age group over 50 has a lower rate of hay fever? Use a -0,05. Do you reject or fail to reject the null hypothesis? Are the data statistically significant at the a - 0.05 level of significance? Since the p-value is greater than the level of significance, the data are not statistically significant. Thus, we fail to reject the null hypothesis. Since the p-value is less than the level of significance, the data are not statistically significant. Thus, we fail to reject the null hypothesis. Since the p-value is greater than the level of significance, the data are statistically significant. Thus, we fail to reject the null hypothesis. Since the p-value is less than the level of significance, the data are statistically significant. Thus, we reject the null hypothesis. Since the p-value is greater than the level of significance, the data are not statistically significant. Thus, we reject the null hypothesis.A study of 800 homeowners in a certain area showed that the average value of the homes was $82,000 and the standard deviation was $5000. If 50 homes are selected for sale, find the probability that the mean of the values of these homes is more than $83,500. Check to see whether the correction factor should be used. If so, be sure to include it in the computation. Show your work or explain how you obtained your answer. If using the graphing calculator, write the function you are using and the numbers you typed into the calculator. a) Compute the z value first rounded to 2 decimal places. b) Compute the probability that the mean of the values of these homes is more than $83,500. An instructor gives a 100-point examination in which the grades are normally distributed. The mean is 72 and the standard deviation is 8. If there are 5% A's, 5% F's, 20% B's, 20% D's, and 50% C's. Compute the interval of scores in the C, D and F categories. Round the cut off scores to the nearest whole number. Round your z value to two decimal places. NOTE: Show your work or explain clearly how you obtained your answers. A local medical association wants to sponsor a footrace to raise money for cancer research. The average time it takes to run the course is 45 minutes with a standard deviation of 2.8 minutes. If the association decides to award certificates to the fastest 20% of the racers, what should the cutoff time be (round to 1 decimal place)? Show some work or explain how you obtained your answer. When using the calculator write the calculator function you are using including the relevant numerical information or numbers you typed into your calculator