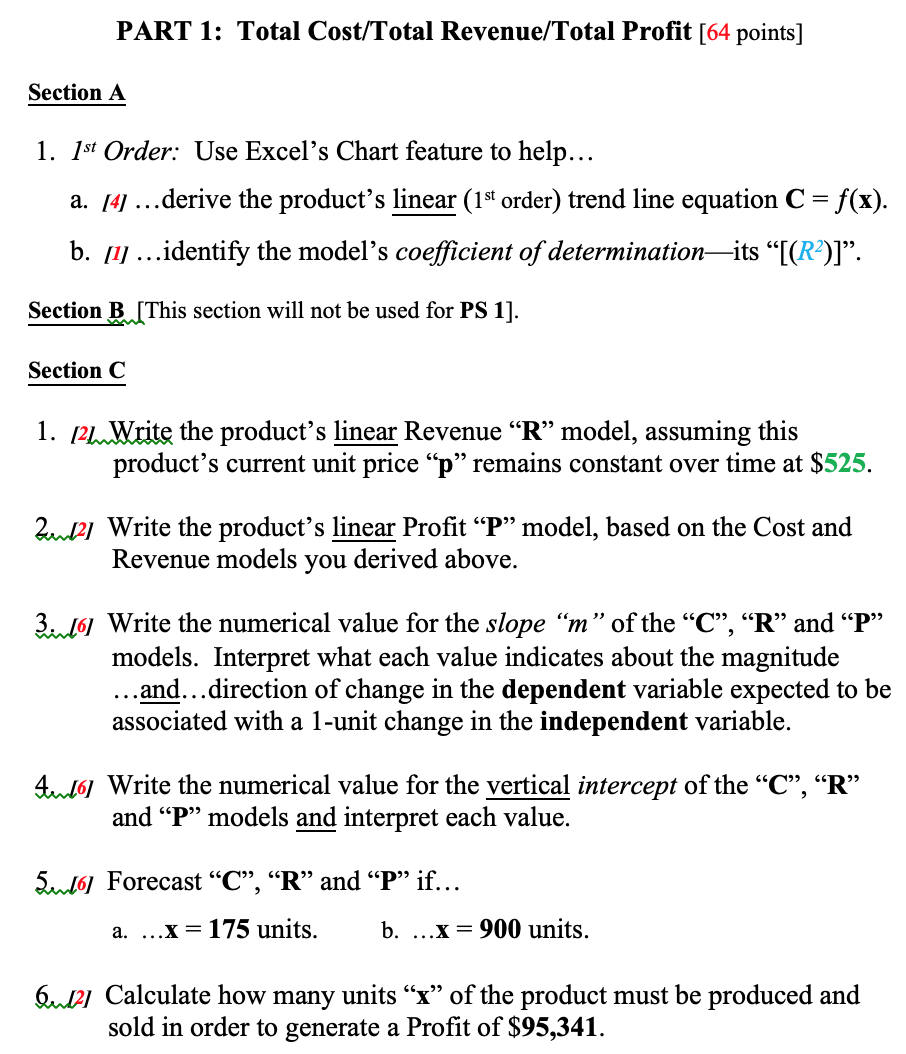
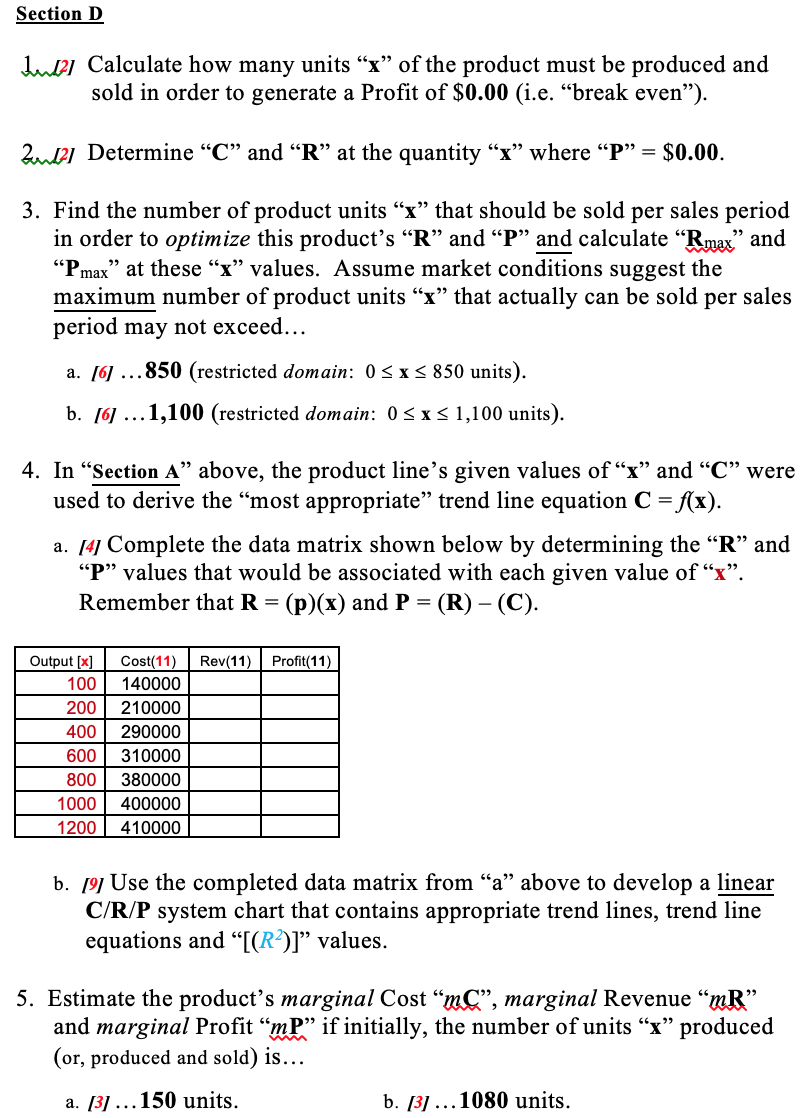
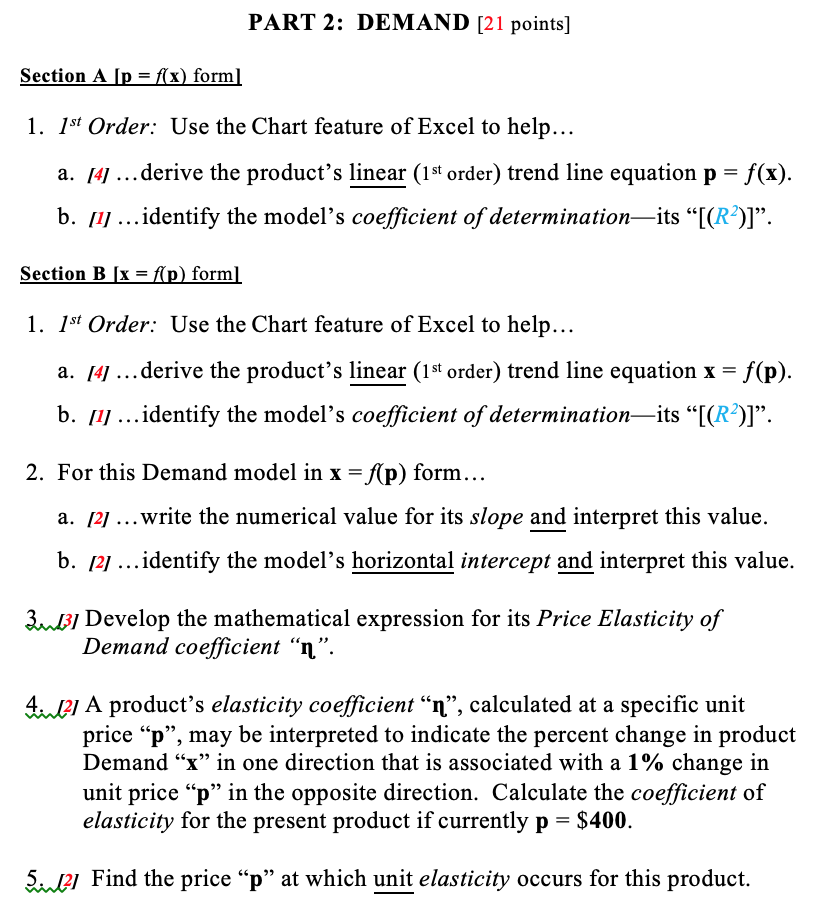
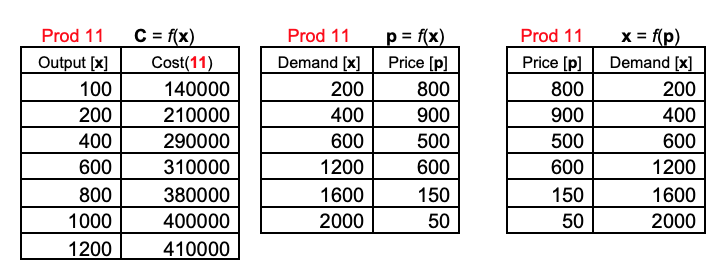
PART 1: Total Cost/Total Revenue/Total Profit [64 points] Section A 1. st Order: Use Excel's Chart feature to help... a. 14 ... derive the product's linear (1st order) trend line equation C = = f(x). b. [1] ... identify the model's coefficient of determinationits [(R2)]. Section B [This section will not be used for PS 1]. Section C 1. 12.Write the product's linear Revenue R model, assuming this product's current unit price p remains constant over time at $525. Zaub21 Write the product's linear Profit P model, based on the Cost and Revenue models you derived above. Z: Write the numerical value for the slope "m" of the C, R and P models. Interpret what each value indicates about the magnitude ... and...direction of change in the dependent variable expected to be associated with a 1-unit change in the independent variable. Auto Write the numerical value for the vertical intercept of the C, R and P models and interpret each value. Femd6] Forecast C, R and P if... a. ...x = 175 units. b. ...x = 900 units. Qui Calculate how many units r of the product must be produced and sold in order to generate a Profit of $95,341. Section D tudi Calculate how many units x of the product must be produced and sold in order to generate a Profit of $0.00 (i.e. break even). Bund21 Determine C and R at the quantity x where P = $0.00. 3. Find the number of product units x that should be sold per sales period in order to optimize this product's R and P and calculate R.max and Pmax at these "x" values. Assume market conditions suggest the maximum number of product units x that actually can be sold per sales period may not exceed... a. [6] ...850 (restricted domain: 0 SXS 850 units). b. [6] ... 1,100 (restricted domain: 05XS 1,100 units). 4. In Section A above, the product line's given values of x and C were used to derive the most appropriate trend line equation C =. = f(x). a. [4] Complete the data matrix shown below by determining the R and P values that would be associated with each given value of x. Remember that R = (p)(x) and P = (R) (C). Rev(11) Profit(11) Output [x] 100 200 400 600 800 1000 1200 Cost(11) 140000 210000 290000 310000 380000 400000 410000 b. [9] Use the completed data matrix from a above to develop a linear C/R/P system chart that contains appropriate trend lines, trend line equations and [(R)]" values. 5. Estimate the product's marginal Cost m%, marginal Revenue "MR" and marginal Profit mP. if initially, the number of units x produced (or, produced and sold) is... a. [3] ... 150 units. b. [3] ... 1080 units. PART 2: DEMAND [21 points] Section A [p = f(x) form] 1. 1st Order: Use the Chart feature of Excel to help... a. [4] ... derive the product's linear (1st order) trend line equation p = f(x). b. [1] ... identify the model's coefficient of determinationits [(R2)]. Section B [x = f(p) form] 1. 1st Order: Use the Chart feature of Excel to help... a. 14 ... derive the product's linear (1st order) trend line equation x = f(p). b. [1] ... identify the model's coefficient of determinationits [(R2)]. 2. For this Demand model in x = f(p) form... a. [2] ... write the numerical value for its slope and interpret this value. b. (2) ... identify the model's horizontal intercept and interpret this value. ZuBj Develop the mathematical expression for its Price Elasticity of Demand coefficient n. 41,12] A product's elasticity coefficient n, calculated at a specific unit price p, may be interpreted to indicate the percent change in product Demand x in one direction that is associated with a 1% change in unit price p in the opposite direction. Calculate the coefficient of elasticity for the present product if currently p = $400. Fil] Find the price p at which unit elasticity occurs for this product. Prod 11 Output [x] 100 200 400 600 800 1000 1200 C = f(x) Cost(11) 140000 210000 290000 310000 380000 400000 410000 Prod 11 Demand [x] 200 400 600 1200 1600 2000 p = f(x) Price [p] 800 900 500 600 150 50 Prod 11 Price [p] 800 900 500 600 150 50 x = f(p) Demand [x] 200 400 600 1200 1600 2000 PART 1: Total Cost/Total Revenue/Total Profit [64 points] Section A 1. st Order: Use Excel's Chart feature to help... a. 14 ... derive the product's linear (1st order) trend line equation C = = f(x). b. [1] ... identify the model's coefficient of determinationits [(R2)]. Section B [This section will not be used for PS 1]. Section C 1. 12.Write the product's linear Revenue R model, assuming this product's current unit price p remains constant over time at $525. Zaub21 Write the product's linear Profit P model, based on the Cost and Revenue models you derived above. Z: Write the numerical value for the slope "m" of the C, R and P models. Interpret what each value indicates about the magnitude ... and...direction of change in the dependent variable expected to be associated with a 1-unit change in the independent variable. Auto Write the numerical value for the vertical intercept of the C, R and P models and interpret each value. Femd6] Forecast C, R and P if... a. ...x = 175 units. b. ...x = 900 units. Qui Calculate how many units r of the product must be produced and sold in order to generate a Profit of $95,341. Section D tudi Calculate how many units x of the product must be produced and sold in order to generate a Profit of $0.00 (i.e. break even). Bund21 Determine C and R at the quantity x where P = $0.00. 3. Find the number of product units x that should be sold per sales period in order to optimize this product's R and P and calculate R.max and Pmax at these "x" values. Assume market conditions suggest the maximum number of product units x that actually can be sold per sales period may not exceed... a. [6] ...850 (restricted domain: 0 SXS 850 units). b. [6] ... 1,100 (restricted domain: 05XS 1,100 units). 4. In Section A above, the product line's given values of x and C were used to derive the most appropriate trend line equation C =. = f(x). a. [4] Complete the data matrix shown below by determining the R and P values that would be associated with each given value of x. Remember that R = (p)(x) and P = (R) (C). Rev(11) Profit(11) Output [x] 100 200 400 600 800 1000 1200 Cost(11) 140000 210000 290000 310000 380000 400000 410000 b. [9] Use the completed data matrix from a above to develop a linear C/R/P system chart that contains appropriate trend lines, trend line equations and [(R)]" values. 5. Estimate the product's marginal Cost m%, marginal Revenue "MR" and marginal Profit mP. if initially, the number of units x produced (or, produced and sold) is... a. [3] ... 150 units. b. [3] ... 1080 units. PART 2: DEMAND [21 points] Section A [p = f(x) form] 1. 1st Order: Use the Chart feature of Excel to help... a. [4] ... derive the product's linear (1st order) trend line equation p = f(x). b. [1] ... identify the model's coefficient of determinationits [(R2)]. Section B [x = f(p) form] 1. 1st Order: Use the Chart feature of Excel to help... a. 14 ... derive the product's linear (1st order) trend line equation x = f(p). b. [1] ... identify the model's coefficient of determinationits [(R2)]. 2. For this Demand model in x = f(p) form... a. [2] ... write the numerical value for its slope and interpret this value. b. (2) ... identify the model's horizontal intercept and interpret this value. ZuBj Develop the mathematical expression for its Price Elasticity of Demand coefficient n. 41,12] A product's elasticity coefficient n, calculated at a specific unit price p, may be interpreted to indicate the percent change in product Demand x in one direction that is associated with a 1% change in unit price p in the opposite direction. Calculate the coefficient of elasticity for the present product if currently p = $400. Fil] Find the price p at which unit elasticity occurs for this product. Prod 11 Output [x] 100 200 400 600 800 1000 1200 C = f(x) Cost(11) 140000 210000 290000 310000 380000 400000 410000 Prod 11 Demand [x] 200 400 600 1200 1600 2000 p = f(x) Price [p] 800 900 500 600 150 50 Prod 11 Price [p] 800 900 500 600 150 50 x = f(p) Demand [x] 200 400 600 1200 1600 2000