Question
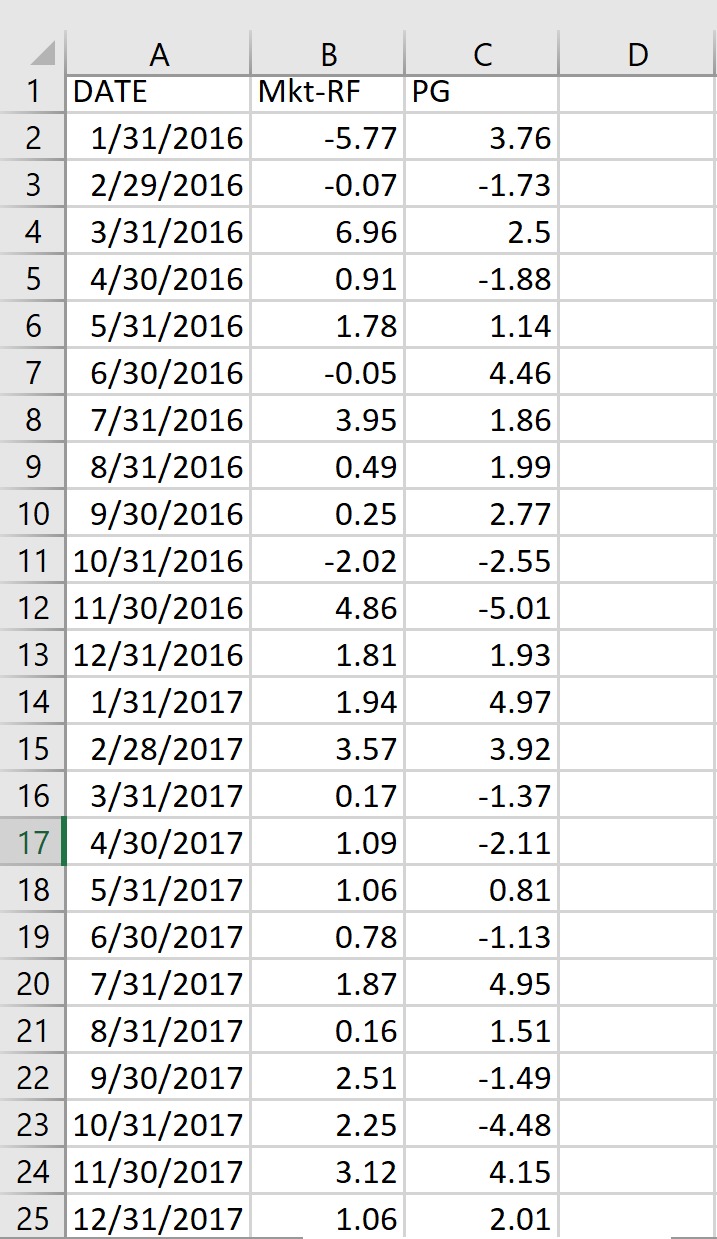
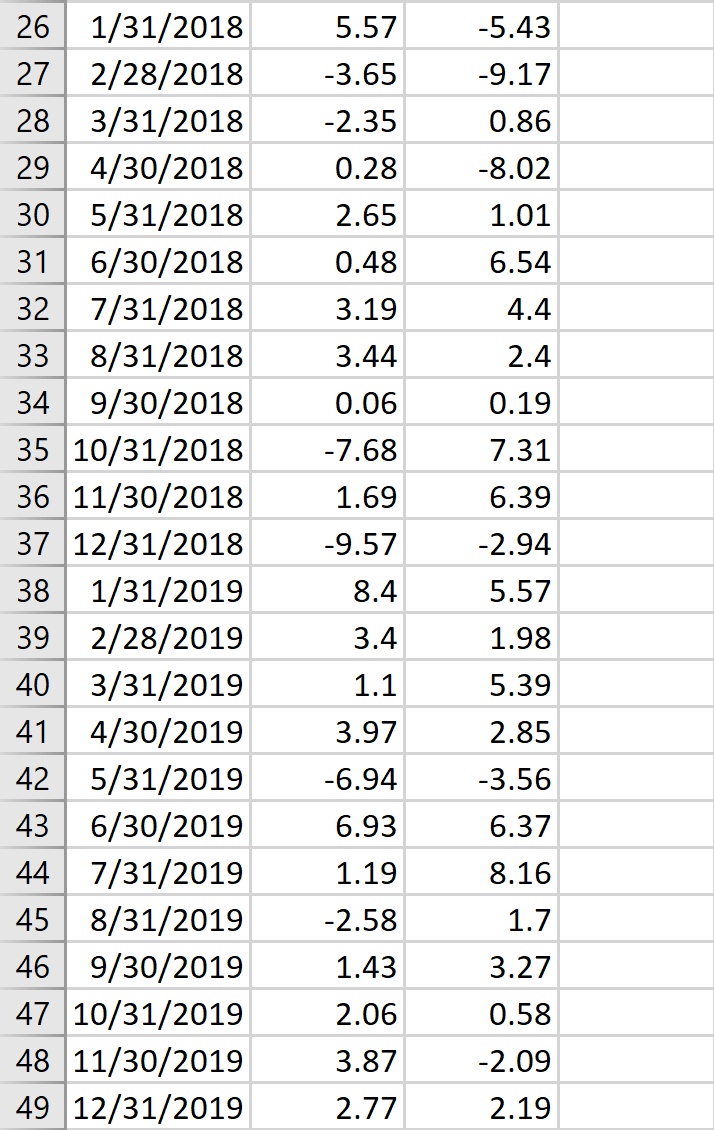
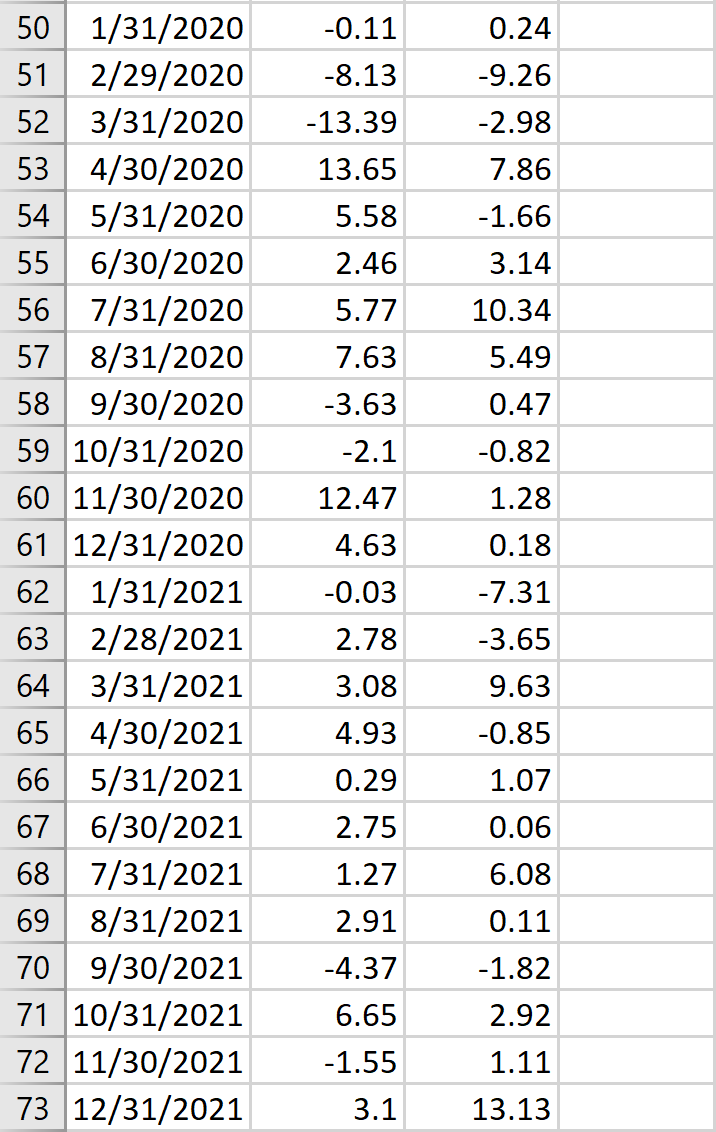
Part 1: Using the data from 2016 through the end of 2021 (not using the 2022 observations) , compute and report the following items for
Part 1: Using the data from 2016 through the end of 2021 (not using the 2022 observations), compute and report the following items for PG stock
1. average excess return 2. return volatility 3. Sharpe ratio 4. CAPM alpha & beta 5. CAPM R2 (R-squared) 6. Treynor ratio
Analysis: Based on the above calculations, would this asset have been a good investment over the 2016-2021 period? Why or why not?
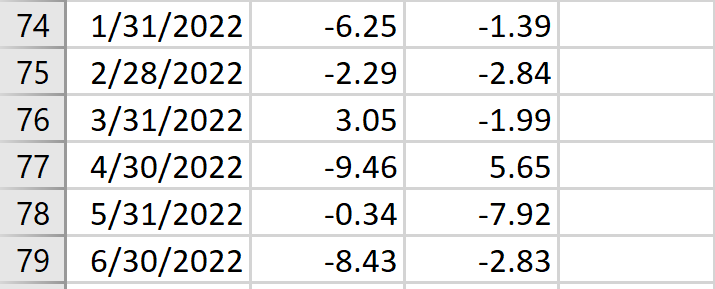
Part 2: Compute the average excess market return for the first half of 2022. With that number in hand, and along with the beta that you computed in Part 1, please provide the expected excess stock return for PG for this period according to the CAPM, ?iE[RM ?Rf ]. Compare this number to the firm's actual average excess return for the first half of 2022. Did PG perform better or worse than expected?
Note: Please complete in Excel. I'm not sure how to do it in Excel.


Step by Step Solution
There are 3 Steps involved in it
Step: 1

Get Instant Access to Expert-Tailored Solutions
See step-by-step solutions with expert insights and AI powered tools for academic success
Step: 2

Step: 3

Ace Your Homework with AI
Get the answers you need in no time with our AI-driven, step-by-step assistance
Get Started


