

Question
Part 1: Z Scores A staple calculation in statistics is the z-score. As a quick reminder, a z-score is a measurement of how many standard
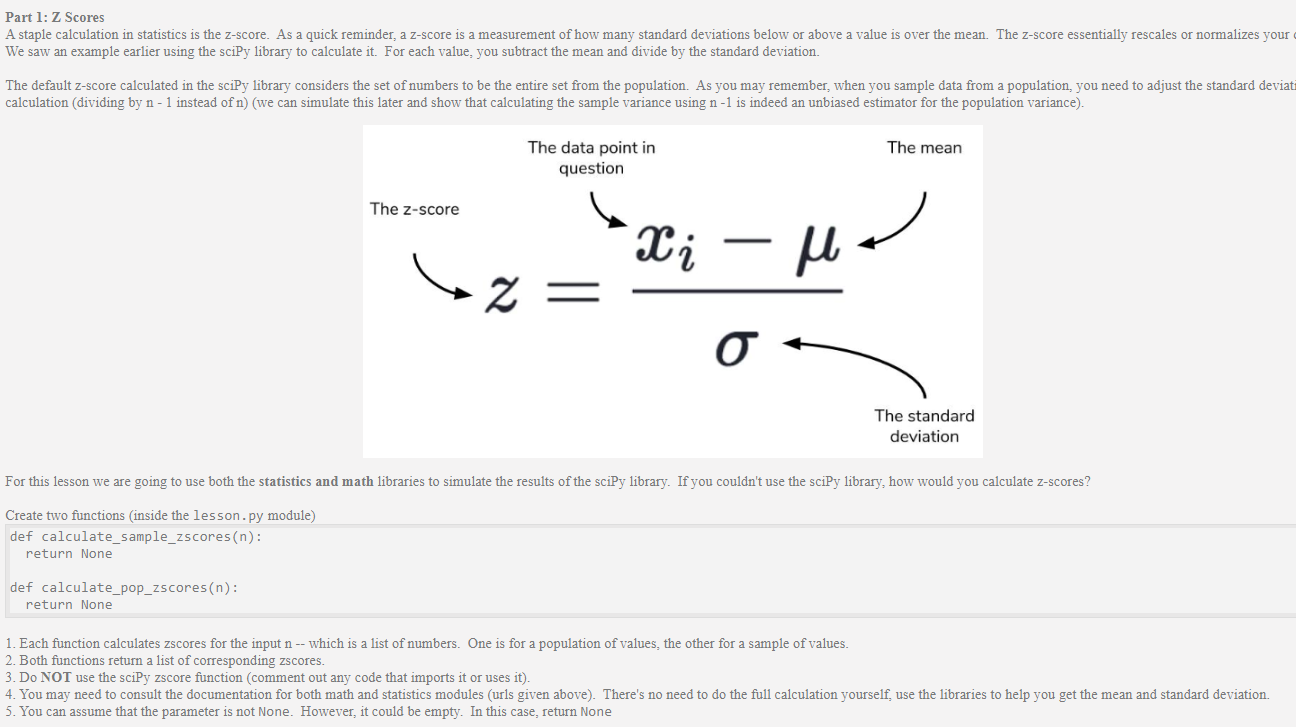
Part 1: Z Scores A staple calculation in statistics is the z-score. As a quick reminder, a z-score is a measurement of how many standard deviations below or above a value is over the mean. The z-score essentially rescales or normalizes your data. We saw an example earlier using the sciPy library to calculate it. For each value, you subtract the mean and divide by the standard deviation.
The default z-score calculated in the sciPy library considers the set of numbers to be the entire set from the population. As you may remember, when you sample data from a population, you need to adjust the standard deviation calculation (dividing by n - 1 instead of n) (we can simulate this later and show that calculating the sample variance using n -1 is indeed an unbiased estimator for the population variance).
For this lesson we are going to use both the statistics and math libraries to simulate the results of the sciPy library. If you couldn't use the sciPy library, how would you calculate z-scores?
Create two functions (inside the lesson.py module)
def calculate_sample_zscores(n): return None def calculate_pop_zscores(n): return None
1. Each function calculates zscores for the input n -- which is a list of numbers. One is for a population of values, the other for a sample of values.
2. Both functions return a list of corresponding zscores.
3. Do NOT use the sciPy zscore function (comment out any code that imports it or uses it).
4. You may need to consult the documentation for both math and statistics modules (urls given above). There's no need to do the full calculation yourself, use the libraries to help you get the mean and standard deviation.
5. You can assume that the parameter is not None. However, it could be empty. In this case, return None
Step by Step Solution
There are 3 Steps involved in it
Step: 1

Get Instant Access to Expert-Tailored Solutions
See step-by-step solutions with expert insights and AI powered tools for academic success
Step: 2

Step: 3
Ace Your Homework with AI
Get the answers you need in no time with our AI-driven, step-by-step assistance
Get Started
Machine Learning And Knowledge Discovery In Databases European Conference Ecml Pkdd 2022 Grenoble France September 19 23 2022 Proceedings Part 4 Lnai 13716
Authors: Massih-Reza Amini ,Stephane Canu ,Asja Fischer ,Tias Guns ,Petra Kralj Novak ,Grigorios Tsoumakas
1st Edition
3031264118, 978-3031264115