

Answered step by step
Verified Expert Solution
Question
1 Approved Answer
part 1-11 Question. Please answer all. I will give a rating if correct. III Homework: Chapter 14 Homework Question 5, P14-11 (similar to) Part 1
part 1-11 Question. Please answer all. I will give a rating if correct. 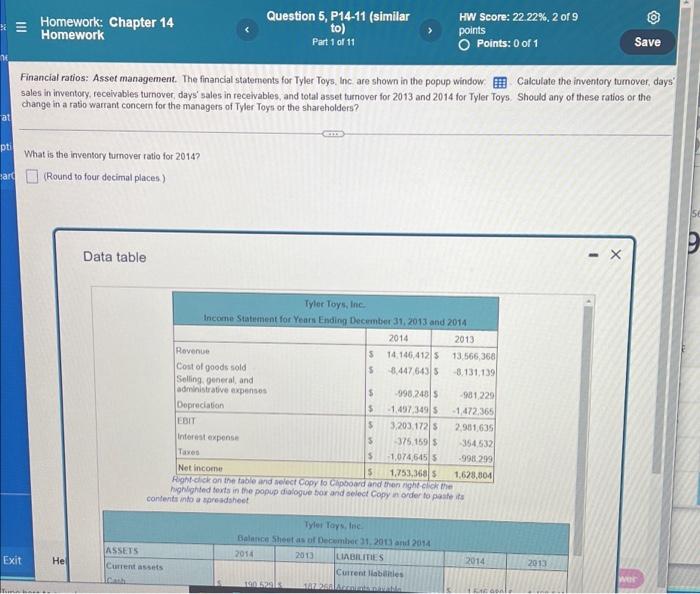
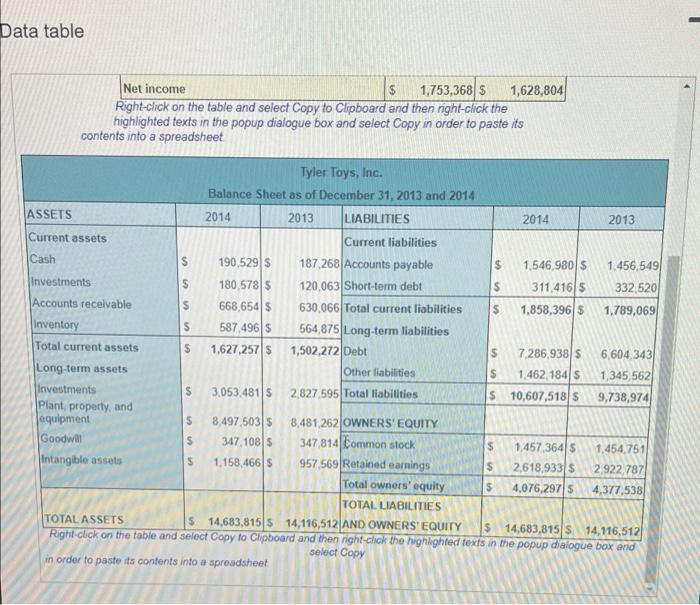
III Homework: Chapter 14 Homework Question 5, P14-11 (similar to) Part 1 of 11 > HW Score: 22.22%, 2 of 9 points Points: 0 of 1 Save Financial ratios: Asset management. The financial statements for Tyler Toys, Inc are shown in the popup window Calculate the inventory turnover, days' sales in inventory, receivables turnover days' sales in receivables, and total asset turnover for 2013 and 2014 for Tyler Toys Should any of these ratios or the change in a ratio warrant concern for the managers of Tyler Toys or the shareholders? al pti What is the inventory turnover ratio for 2014? (Round to four decimal places) ard Data table - X Tyler Toys, Inc. Income Statement for Years Ending December 31, 2013 and 2014 2014 2013 Revenue 14.146.412 S 13.566,368 Cost of goods sold 5 3.4476435 8.131.139 Selling general and administrative expenses 5 998.2485 -981229 Depreciation $ -1.497,3495 -1472,365 EBIT $ 3.203.172 5 2.981.635 Interest expense 5 -375 159 354532 Taves $ -1,0746455 -998.299 Net Income 5 1.753.3685 1,628,804 Right click on the table and select Copy to clipboard and then right click the highlighted texts in the popup dialogue box and select Copy in order to paste its contents into a moreadsheet Tyler Toys Inc Balance Sheets of December 31, 2013 anul 2014 2014 2013 LIABILITIES Current lates Exit He ASSETS Current assets 2014 2013 Data table Net income $ 1,753,368 $ 1,628,804 Right-click on the table and select Copy to Clipboard and then right-click the highlighted texts in the popup dialogue box and select Copy in order to paste its contents into a spreadsheet Tyler Toys, Inc. Balance Sheet as of December 31, 2013 and 2014 ASSETS 2014 2013 LIABILITIES 2014 2013 Current assets Current liabilities Cash 190,529 $ 187 268 Accounts payable $ 1,546,980$ 1.456,549 Investments 5 180,578$ 120,063 Short-term debt $ 311,4165 332,520 Accounts receivable $ 668,654 $ 630 066 Total current liabilities 1,858,396 5 1,789,069 Inventory $ 587 496 $ 564,875 Long-term liabilities Total current assets $ 1,627,257 $ 1,502,272 Debt $ 7.286,938$ 6,604.343 Long-term assets Other liabilities S 1.462 184 5 1,345 562 Investments 3.053,481 S 2,827,595 Total liabilities $ 10,607,518$ 9,738,974 Plant, property, and equipment $ 8,497 503 $ 8,481,262 OWNERS' EQUITY Goodwal $ 347 1085 347 814 Common stock $ 1,457 3645 1,454,761 Intangible assets 1.158,4665 957,569 Retained earnings $ 2,618,933 $ 2.922,787 Total owners' equity $ 4,076,2975 4,377,538) TOTAL LIABILITIES TOTAL ASSETS 14,683,815 5 14,116,512 AND OWNERS'EQUITY $ 14,683,815 $ 14,116,512 Right click on the table and select Copy to clipboard and then right-click the highlighted texts in the popup dialogue box arid Select Copy in order to paste its contents into a spreadsheet $ GA $ Step by Step Solution
There are 3 Steps involved in it
Step: 1

Get Instant Access to Expert-Tailored Solutions
See step-by-step solutions with expert insights and AI powered tools for academic success
Step: 2

Step: 3
Ace Your Homework with AI
Get the answers you need in no time with our AI-driven, step-by-step assistance
Get Started
Blueprint For Success Writing Business Plans For Engineering Startups
Authors: Maxwell E. Uduafemhe Phd
1st Edition
979-8862953190