

Answered step by step
Verified Expert Solution
Question
1 Approved Answer
part 1/2 Intro The following table shows historical end-of-year prices for a stock. B 1 Year Stock price 2 1 30.28 2 33.41 3 25.23
part 1/2 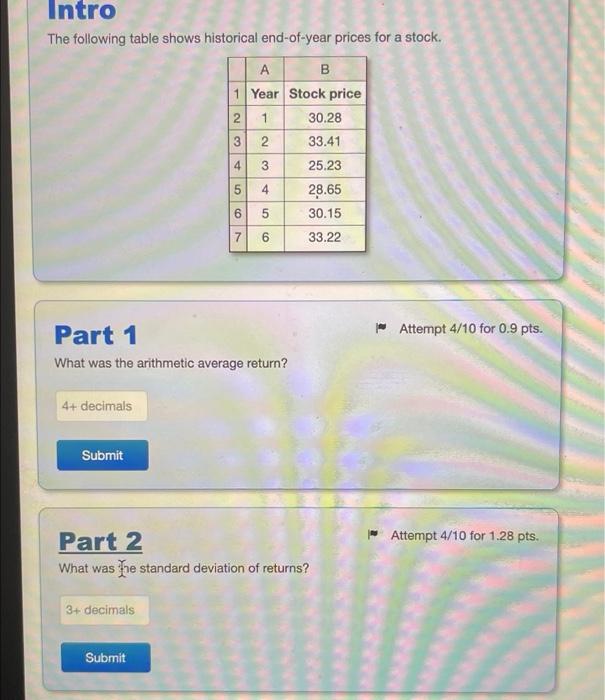
Intro The following table shows historical end-of-year prices for a stock. B 1 Year Stock price 2 1 30.28 2 33.41 3 25.23 4 28.65 6 5 30.15 1 3 4 5 7 6 33.22 Home Attempt 4/10 for 0.9 pts. Part 1 What was the arithmetic average return? 4+ decimals Submit - Attempt 4/10 for 1.28 pts. Part 2 What was the standard deviation of returns? 3+ decimals Submit Step by Step Solution
There are 3 Steps involved in it
Step: 1

Get Instant Access to Expert-Tailored Solutions
See step-by-step solutions with expert insights and AI powered tools for academic success
Step: 2

Step: 3
Ace Your Homework with AI
Get the answers you need in no time with our AI-driven, step-by-step assistance
Get Started
Options On Futures Workbook Step By Step Exercises And Tests To Help You Master Options On Futures New Trading Strategies
Authors: John F. Summa ,Jonathan W. Lubow
1st Edition
0471436437, 978-0471436430