

Answered step by step
Verified Expert Solution
Question
1 Approved Answer
Part 1-7 question. question 6. Sez III Homework: Chapter 14 Homework Question 6, P14-12 (similar to) Part 1 of 7 HW Score: 22.22%, 2 of
Part 1-7 question. question 6. 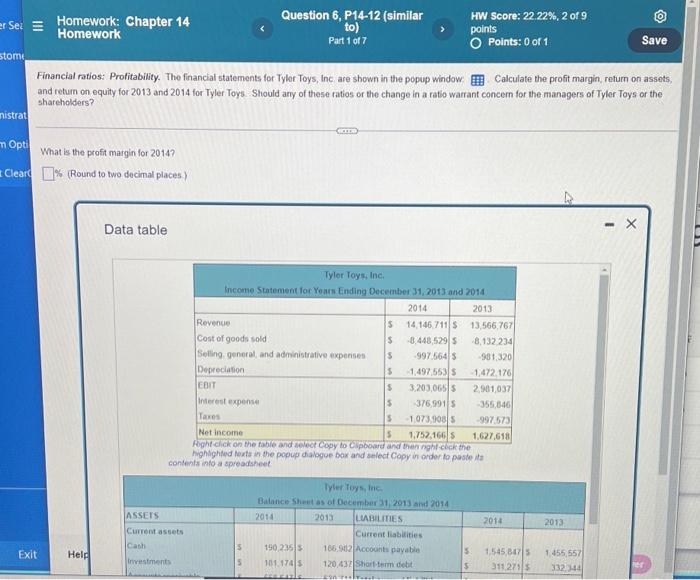
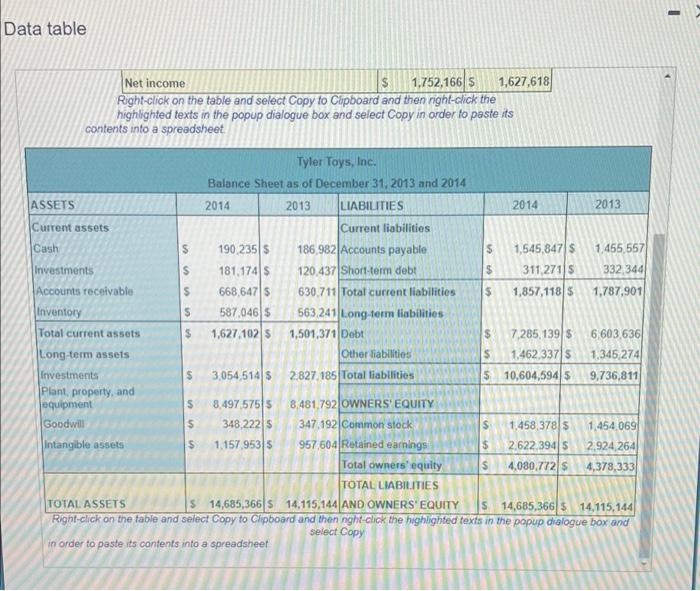
Sez III Homework: Chapter 14 Homework Question 6, P14-12 (similar to) Part 1 of 7 HW Score: 22.22%, 2 of 9 points Points: 0 of 1 Save stomi Financial ratios: Profitability. The financial statements for Tyler Toys, Inc are shown in the popup window Calculate the profit margin, return on assets, and return on equity for 2013 and 2014 for Tyler Toys Should any of these ratios or the change in a ratio warrant concern for the managers of Tyler Toys or the shareholders? nistrat m Opti What is the profit margin for 2014? Clear 1% (Round to two decimal places Data table Tyler Toys, Inc. Income Statement for Years Ending December 31, 2013 and 2014 2014 2013 Revenue $ 14,146.7115 13,566,767 Cost of goods sold $ 8.448,5295 8.132 234 Selling general and administrative expenses $ 997 5645 981,320 Depreciation $ 1,497 5535 1.472 176 EBIT $ 3,203,0655 2,901,037 Interest expense 5 376 99115 355,640 Taxes 5 1 073 908 997 573 Net income S 1.752.166 1.627.618 Right click on the table and select Copy to clipboard and the right click the highlighted to the popup dialogue box and select Copy in order to paste its contents into a spreadsheet Tyler Toys, ing Balance Sheet as of December 31, 2013 and 2014 2014 2013 LIABILITIES Current liabilities 190 2355 166 902 Accounts payable 101 1745 120.437 Short-term debit 2014 ASSETS Current assets Cash 2013 5 Exit Held 5 Investments 5 1.545 3475 31127015 1455,557 332,344 5 Data table Net income 1s $ 1,752,166 S 1,627,618 Right click on the table and select Copy to Clipboard and then right-click the highlighted texts in the popup dialogue box and select Copy in order to paste its contents into a spreadsheet $ Tyler Toys, Inc. Balance Sheet as of December 31, 2013 and 2014 ASSETS 2014 2013 LIABILITIES 2014 2013 Current assets Current liabilities Cash S 190,235 5 186,982 Accounts payable $ 1,545,847 $ 1.455 557 Investments $ 181,1745 120.437 Short-term debt $ 311 271 5 332 344 Accounts receivable $ 668,6475 630711 Total current liabilities $ 1,857,118 5 1,787,901 Inventory $ 587,0465 563 241 Long-term liabilities Total current assets $ 1,627 1025 1,501,371 Debt s 7.285,139 $ 6,603 636 Long term assets Other liabilities $ 1.462 337 $ 1,345 274 Investments $ 3,054,514 $ 2,827.185 Total liabilities 5 10,604,594 5 9,736,811 Plant, property, and equipment S 8.4975755 8.481,792 OWNERS' EQUITY Goodwill $ 348.2225 347,192 Common stock $ 1,458,37815 1.454.069 Intangible assets $ 1.157,953 $ 957 604 Retained earnings $ 2.622,3945 2.924, 264 Total owners' equity s 4,080.772 $ 4,378,333 TOTAL LIABILITIES TOTAL ASSETS s 14,685,366 s 14,115,144 AND OWNERS' EQUITY S 14,685,366 $ 14,115,144 Right click on the table and select Copy to clipboard and then night click the highlighted texts in the popup dialogue box and Select Copy in order to paste its contents into a spreadsheet Step by Step Solution
There are 3 Steps involved in it
Step: 1

Get Instant Access to Expert-Tailored Solutions
See step-by-step solutions with expert insights and AI powered tools for academic success
Step: 2

Step: 3
Ace Your Homework with AI
Get the answers you need in no time with our AI-driven, step-by-step assistance
Get Started
Freaking Idiots Guide Ebay Bundle
Authors: Nick Vulich
1st Edition
1495308456, 978-1495308451