Answered step by step
Verified Expert Solution
Link Copied!

Question

1 Approved Answer

Part 2: Auto dataset revisited We also used the auto dataset two weeks ago in lab 6. We used it with LDA and QDA. Both

Part 2: Auto dataset revisited

We also used the auto dataset two weeks ago in lab 6. We used it with LDA and QDA. Both methods in R provide a CV argument that will compute a LOOCV estimate for us. If we want to compute a k-fold cross validation estimate when k is not equal to the number of instances, we have to either write our own code or find another library to use. Here we will write our own code! Write a function that accepts a dataframe, a model-building function (either lda or qda), and a value for K and returns an error estimate and its variance for k-fold cross validation. Use this function to generate values for the same kind of table you made in part 1. Compare these values to using the training set and a validation set to estimate the error rates, too. Finally, include a paragraph summarizing and explaining the results just as you did in part 1.

Below is the code in R markdown with the auto data, the training and testing split, and with the Linear Discriminant Analysis (LDA) and Quadratric Discriminant Analysis. and
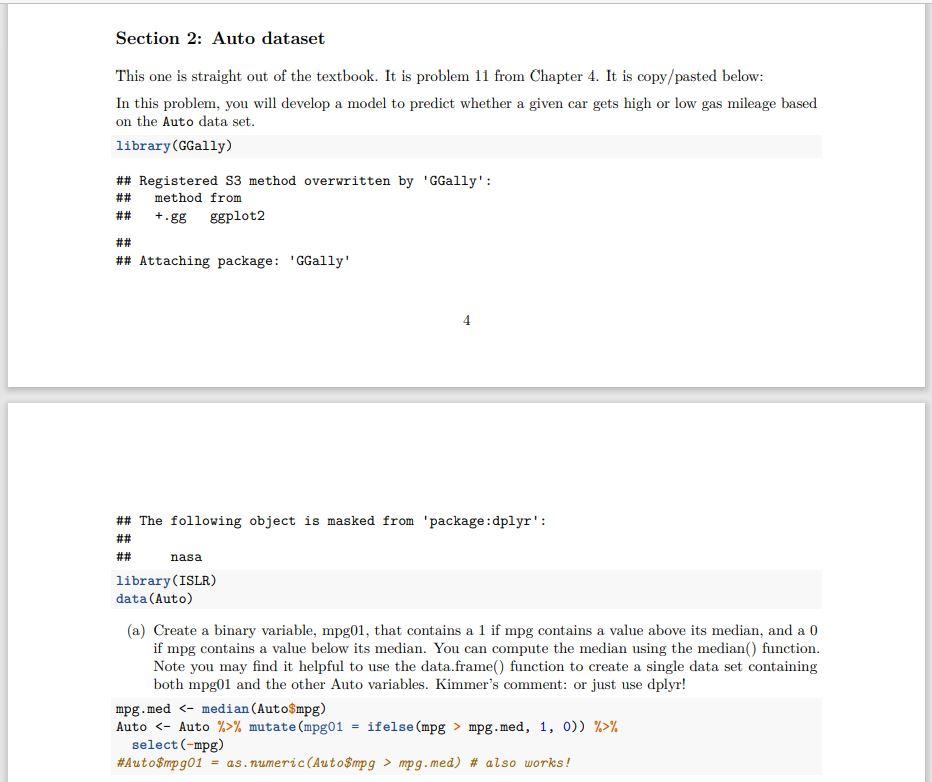
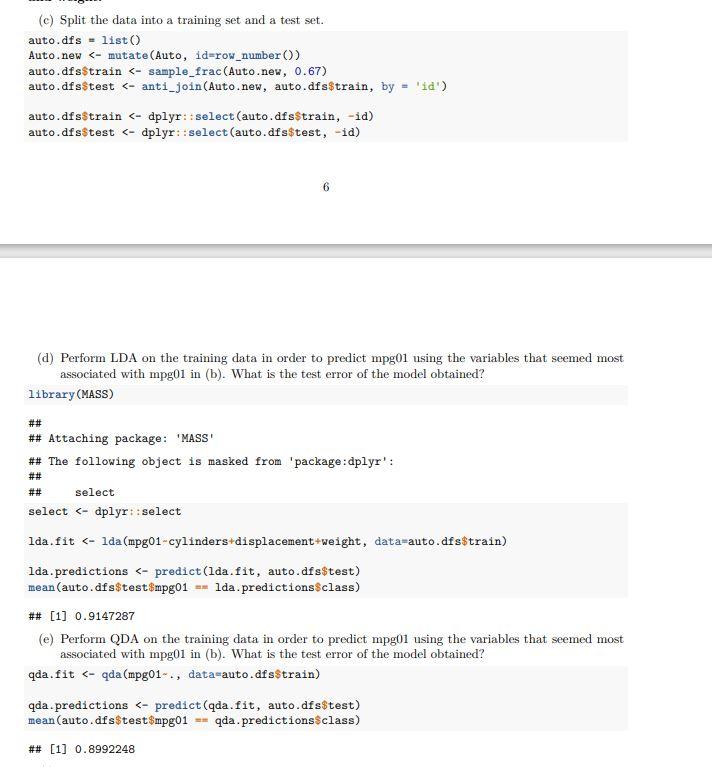
image text in transcribed

image text in transcribed

Section 2: Auto dataset This one is straight out of the textbook. It is problem 11 from Chapter 4. It is copy/pasted below: In this problem, you will develop a model to predict whether a given car gets high or low gas mileage based on the Auto data set. library (GGally) ## Registered s3 method overwritten by 'Gally': method from ggplot2 ## ## Attaching package: 'Gally' ## ## +.88 4 ## The following object is masked from 'package:dplyr': ## ## nasa library(ISLR) data (Auto) (a) Create a binary variable, mpg01, that contains a 1 if mpg contains a value above its median, and a 0 if mpg contains a value below its median. You can compute the median using the median() function. Note you may find it helpful to use the data.frame() function to create a single data set containing both mpg01 and the other Auto variables. Kimmer's comment: or just use dplyr! mpg.med % mutate (mpg01 = ifelse (mpg > mpg.med, 1, 0)) %>% select (-mpg) #Auto$mpg01 as. numeric(Auto$mpg > mpg.med) # also works! (c) Split the data into a training set and a test set. auto.dfs - list() Auto.new % mutate (mpg01 = ifelse (mpg > mpg.med, 1, 0)) %>% select (-mpg) #Auto$mpg01 as. numeric(Auto$mpg > mpg.med) # also works! (c) Split the data into a training set and a test set. auto.dfs - list() Auto.new

Step by Step Solution

There are 3 Steps involved in it

Step: 1

blur-text-image

Get Instant Access to Expert-Tailored Solutions

See step-by-step solutions with expert insights and AI powered tools for academic success

Step: 2

blur-text-image

Step: 3

blur-text-image

Ace Your Homework with AI

Get the answers you need in no time with our AI-driven, step-by-step assistance

Get Started

Recommended Textbook for

Databases And Python Programming MySQL MongoDB OOP And Tkinter

Authors: R. PANNEERSELVAM

1st Edition

9357011331, 978-9357011334

More Books

Students also viewed these Databases questions

Question

Explain budgetary Control

Answered: 1 week ago

Question

Solve the integral:

Answered: 1 week ago

Question

What is meant by Non-programmed decision?

Answered: 1 week ago

Question

What are the different techniques used in decision making?

Answered: 1 week ago

Question

Explain the function and purpose of the Job Level Table.

Answered: 1 week ago